Peter Smith

Ethereum (ETH) traders are noticing something unsettling: the current price chart looks remarkably similar to what happened back in 2021. Both periods show the same basic story—a sharp climb toward the $3,900–$4,200 range, followed by a quick rejection and sideways movement. The question now is whether this pattern signals trouble ahead or just another bump on the road to higher prices.
Ethereum's Price Pattern Raises Familiar Questions
Ali, a well-known market analyst, recently highlighted how closely today's ETH/USDT chart matches the structure we saw during Ethereum's 2021 peak. The similarities are hard to ignore. In both cases, price surged rapidly into the upper range before getting pushed back down and entering a consolidation phase.
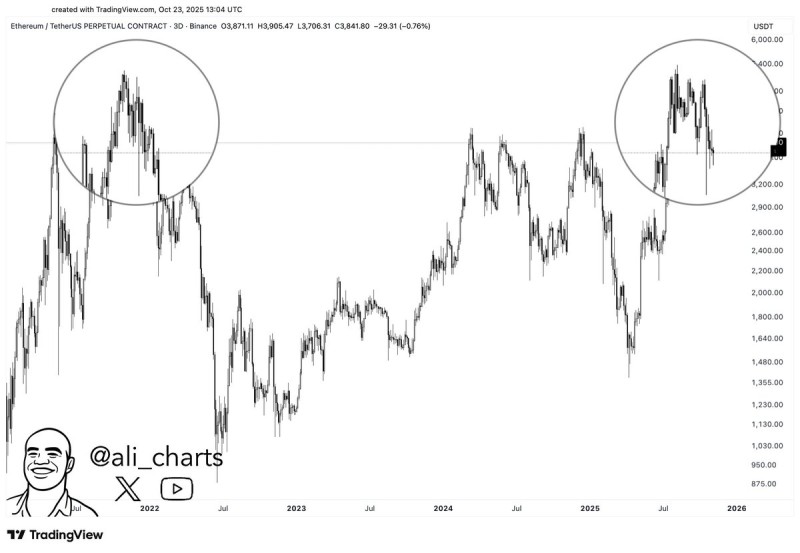
The trading community is split on what this means. Some see it as an early warning of a double-top formation—a classic bearish reversal pattern. Others argue it's just a normal correction that happens mid-cycle before another rally kicks in.
Chart Analysis: Symmetry and Key Support Levels
Looking at the 3-day chart, Ethereum has been struggling around $3,800–$3,900, the same area where it got rejected in both 2021 and 2025. Each highlighted zone shows the same pattern: strong vertical movement followed by sharp pullbacks. Right now, ETH is holding just above $3,700, but the real battleground is around $3,000. That level acted as critical support before, and losing it in 2021 led to a much deeper drop toward $1,800–$2,000.
If Ethereum manages to stay above $3,000–$3,100, it could form a higher low, which would actually be bullish and suggest the uptrend is still intact. A move back toward $3,900–$4,200 would confirm that momentum is returning. But if price closes decisively below $2,900, that would likely confirm the bearish scenario and open the door to further downside.
Market Context and Drivers
Several factors are shaping Ethereum's current behavior. Capital has been rotating into Bitcoin thanks to institutional inflows through ETFs, temporarily reducing ETH's market dominance. Rising U.S. yields and a stronger dollar are also adding pressure to risk assets across the board, including crypto. On the fundamental side, though, things still look solid: Layer-2 adoption continues to grow, staking is expanding, and gas efficiency improvements are making the network more attractive long-term. This creates an interesting dynamic where short-term chart patterns clash with strong underlying fundamentals.
What Traders Are Watching Next
For most traders, the $3,000 level has become the line that matters most. Holding above it keeps Ethereum in a long-term bullish structure and leaves room for a rebound toward $4,000. Losing it would activate the double-top scenario and increase the risk of a drop toward $2,600 or lower. Beyond price levels, traders are also watching volume trends and ETH/BTC relative strength to see which side of the market gains control in the coming weeks.
 Peter Smith