 Saad Ullah

⬤ Bitcoin's current trading pattern and Gold's 2018 price action. The comparison shows Gold dropping sharply before settling into a sideways trading box—a consolidation period marked with "We Are Here" on the chart. Bitcoin now appears to be tracing that same pattern, sitting inside a nearly identical consolidation zone that mirrors Gold's pre-rally base structure from six years ago.
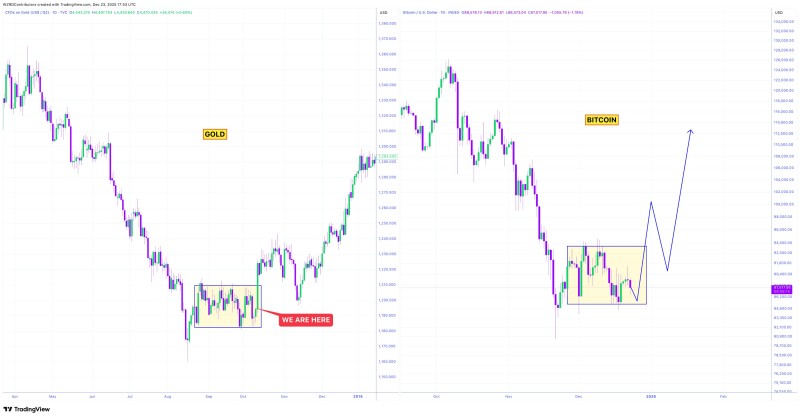
⬤ The Gold chart shows a classic setup: a decline, followed by tight horizontal movement where XAU traded in a narrow band before eventually breaking higher. Bitcoin's recent action looks remarkably similar, bouncing within a comparable boxed range. The analyst's chart projects an upward trajectory from this consolidation, suggesting BTC could follow the same breakout path Gold took after completing its 2018 base.
⬤ "Patience Pays" reads the analysis, hinting that Bitcoin might need more time inside this sideways phase before making its next decisive move. The comparison doesn't put dates on anything or guarantee outcomes—it's purely about the structural echo between how Bitcoin and Gold have traded. Right now, BTC continues moving inside that highlighted range with choppy but contained action, looking a lot like a market that's building a foundation rather than breaking down.
⬤ This pattern matters because analogies between Bitcoin and traditional safe-haven assets like Gold shape how traders view BTC's role in broader markets. If Bitcoin keeps following Gold's 2018 script, it could reset expectations around volatility and timing while reinforcing the idea that BTC sometimes acts more like digital gold than just another speculative asset. The setup also underscores something often forgotten during flat markets: consolidation isn't weakness—it's preparation.
 Saad Ullah


