 Artem Voloskovets

⬤ Nvidia shares have cooled off after a solid run, currently trading near $187.49 on the 4-hour chart. The stock pushed through several moving averages and resistance points before hitting a top and pulling back a bit. Right now, everyone's watching to see if NVDA can shake off that top candle and turn the breakout zone into proper support.
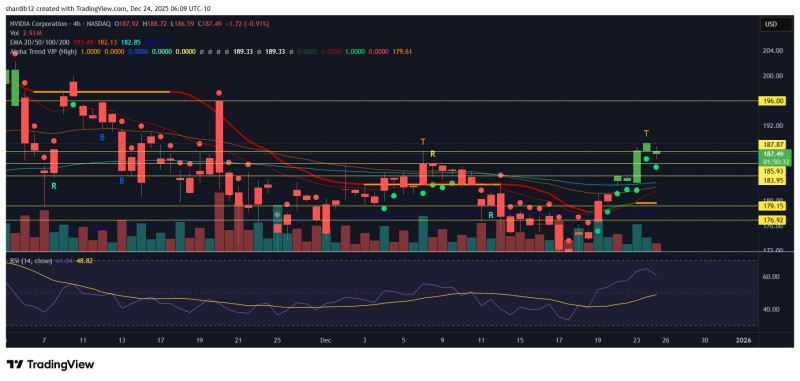
⬤ The chart shows NVDA sitting above a bunch of moving averages—the 20, 50, 100, and 200-period EMAs are all stacked between $178 and $183. There are resistance levels marked around $185.93 and $187.87, with lower support zones near $179.15 and $176.92. The stock's still below a bigger resistance line at about $196, which stopped it earlier this month. Volume picked up during the rally, though the RSI has backed off from higher levels as the stock takes a breather.
⬤ The ideal technical setup would have NVDA hold above nearby support and cancel out the bearish vibes from that last top candle. The chart highlights several past resistance zones and range structures that have shaped price movement lately. The next few sessions are going to be crucial in figuring out whether momentum kicks back in or if we're headed for a deeper cooldown.
⬤ This price action matters because Nvidia is one of the most-watched large-cap tech stocks out there. When NVDA hits technical turning points, it tends to influence sentiment across the whole semiconductor sector and growth stocks in general. A clean support retest would back up the positive trend from the past week, while breaking below current levels would signal that traders are still cautious after the recent pop as we head into year-end.
 Artem Voloskovets


