Saad Ullah

Ethereum has been pushing gradually higher after a sharp rebound from around $2,190, but the structure of that recovery looks fragile. Crypto Tony flagged the setup as a classic slow grind into resistance — the kind of price action that often resolves with a brief false breakout before sellers take control and push the market lower.
ETH Grinds Into a Clear Ceiling Near $2,270
The chart tells a straightforward story. Price bounced hard from the $2,190 area, briefly showing some strength, then shifted into a slow, tight climb with small candles stacking higher lows. That transition from a sharp impulse to a controlled grind is the first warning sign. Strong trends don't typically slow down like this right before breaking through resistance — they accelerate.
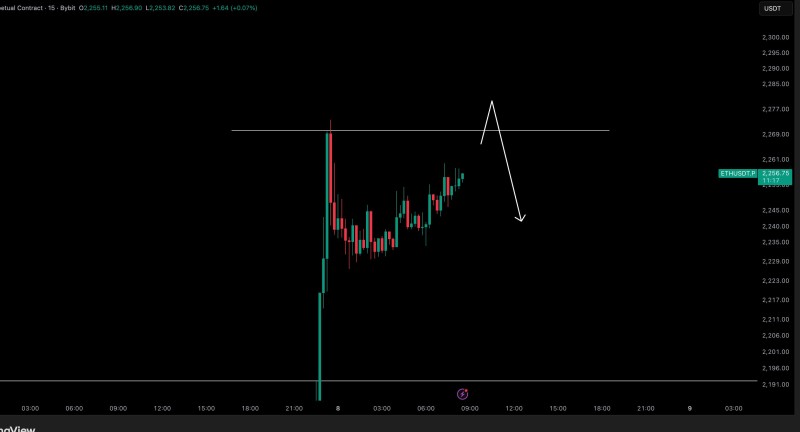
The horizontal zone around $2,270 already produced one rejection, with a visible wick marking it as a supply area. That prior reaction makes the level more significant. ETH has faced similar compression setups before, and the resolution hasn't always gone in the bulls' favor.
Price is grinding slowly into resistance — the setup points to a fakeout followed by a drop
ETH Fakeout Pattern Aligns With Classic Technical Behavior
The core concern here is a liquidity sweep. A move just above $2,270 could trigger breakout buyers, pulling in fresh long positions right before the market reverses. That kind of false break is one of the more reliable traps in technical analysis — buyers chase the breakout, resistance holds, and the subsequent drop is accelerated by all the stops sitting just below entry.
Ethereum has already been showing signs of structural weakness, with bearish signals appearing across multiple timeframes and indicators. A fakeout at this resistance would fit neatly into that broader picture.
The slow grind into supply, without any real momentum, is exactly how fakeouts tend to set up before the drop comes
Ethereum Structure Stays Vulnerable Without a Clean Breakout
ETH hasn't broken and held above resistance yet. Instead, price is compressing beneath the level — which is a different thing entirely from building up for a genuine breakout. The key structural points from the chart are clear:
- Resistance remains intact near $2,270
- Price is forming a slow upward grind, not an impulsive breakout
- The base of the move sits around $2,190
Until one of those changes — either a sustained hold above $2,270 or a breakdown below $2,190 — the market is effectively in a holding pattern. The ETH/BTC pair adds another layer to watch, as Ethereum's relative strength against Bitcoin could influence how this setup resolves.
Unless Ethereum breaks above resistance and holds, the structure keeps the door wide open for a move back down
The contrast between the initial sharp move and the weak follow-through that came after is ultimately what makes this setup worth watching. Strong impulse followed by a hesitant grind under resistance is a familiar pattern — and it rarely ends with a clean breakout.
 Saad Ullah