 Marina Lyubimova

⬤ Ethereum is starting to show some real technical shifts against Bitcoin after spending years stuck in a range. ETH/BTC looks like it might finally be setting up for something bigger, with price action hinting that the long accumulation phase could be wrapping up. The long-term chart reveals a descending trendline from 2021 that's now getting tested as price pushes higher.
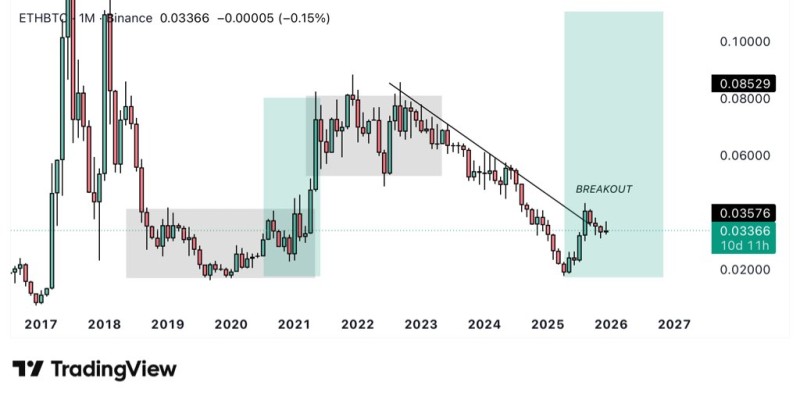
⬤ Looking back, ETH/BTC has done this before—spending months building a base against Bitcoin before suddenly taking off. Right now, the setup looks familiar. Price bounced from the lower range near 0.02 and climbed toward the 0.033–0.035 zone. The potential breakout area marks a move above that multi-year trendline that's been keeping price in check.
⬤ Still, confirmation is everything here. A clean weekly close above this consolidation range would help prove the breakout is real and not just another fakeout. Momentum has been building gradually rather than exploding overnight, which actually fits how these relative strength cycles usually start—quietly. Historically, when Ethereum starts outperforming Bitcoin, it tends to happen before the broader altcoin market catches fire, not during peak hype.
⬤ This matters because traders watch ETH/BTC as a signal for when capital starts flowing beyond just Bitcoin. When Ethereum holds gains against BTC, it usually means risk appetite is shifting and interest in the wider crypto space is picking up. Past patterns don't guarantee future results, but the current structure has people paying attention as a possible early sign of a bigger trend change.
 Marina Lyubimova


