Saad Ullah

Ethereum is back in the spotlight after a market participant disclosed adding $25,000 into ETH at $1,800, calling the asset oversold. ETH has tested the $1,800 support level multiple times, and the bull case here rests on three pillars: accelerating institutional adoption, Ethereum's role as the backbone of the stablecoin market, and a five-year price target of $20,000.
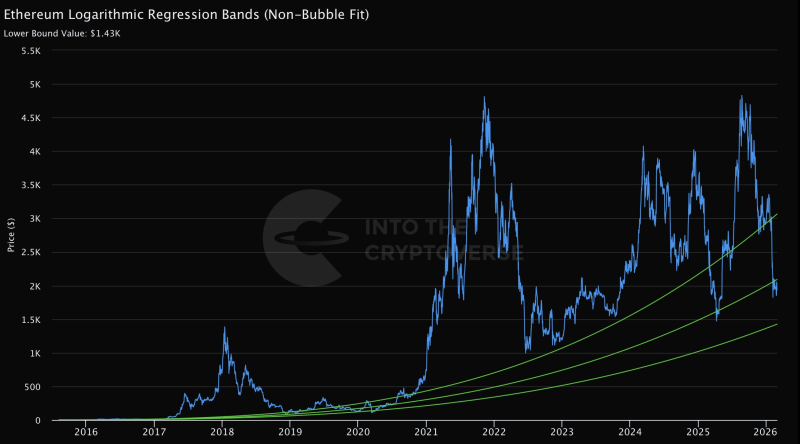
The chart in question - "Ethereum Logarithmic Regression Bands (Non-Bubble Fit)" - plots ETH's price history against long-term regression curves, with the Lower Bound Value sitting at $1.43K. At $1,800, the entry sits just above that lower bound and well below the peaks of prior cycles. The chart traces boom-bust patterns going back to 2016: sharp run-ups, deep drawdowns, and eventual recoveries that hugged the lower bands before the next expansion. Ethereum's stablecoin supply has since hit a record $168B, adding weight to the DeFi infrastructure argument.
The regression chart doesn't directly flag "oversold," but it does show ETH sitting far closer to its long-term lower bands than to the upper extremes seen at previous market tops. The $20,000 target is framed as a five-year outcome anchored to the belief that Ethereum's adoption curve stays intact - not a near-term call. ETH transaction count is already nearing 70M as network activity surges in early 2026, which lines up with the broader adoption narrative.
What makes this noteworthy is the framing: this is a long-duration positioning argument, not a short-term trade. If ETH continues tracking within its historical regression structure, the gap between lower-band levels and past cycle highs shows just how much room prior expansions created. That said, the $20,000 projection is still a forecast. The chart gives context - it doesn't promise a destination.
 Saad Ullah