 Eseandre Mordi

⬤ Ethereum has been consolidating as traders watch major liquidity clusters on derivatives order books. ETH currently sits between significant downside and upside liquidity pools, with the market showing heightened sensitivity to these levels. The heatmap reveals dense liquidity bands both below and above the current price, making short-term positioning around these zones crucial.
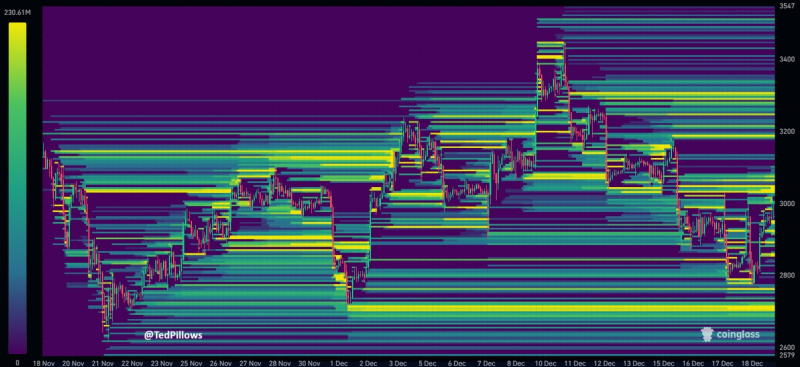
⬤ Below the current price, a major liquidity cluster sits near $2,700. This thick band on the heatmap shows substantial resting orders that could pull price lower if selling accelerates. But there's consistent bid support closer to $2,800, where buyers have actively defended the level in recent sessions. This defense has prevented deeper drops despite broader crypto market volatility.
⬤ Above current levels, liquidity clusters appear around $3,000 and $3,300. These zones clearly stand out on the heatmap, marking areas where stop orders and resting liquidity could trigger if price pushes higher. ETH has repeatedly held above $2,800, increasing the odds of a move toward upper liquidity targets rather than an immediate drop to the $2,700 cluster.
⬤ Liquidity-driven moves often dictate short-term volatility in major crypto assets. When bid zones hold firm, price typically seeks higher liquidity concentrations, while support failures can quickly expose lower levels. Ethereum's current setup shows how order book dynamics are driving near-term price action more than macro headlines. With liquidity tightly clustered around these levels, expect directional moves to follow shifts in order flow rather than sudden trend reversals.
 Eseandre Mordi


