Sergey Diakov

Ethereum broke decisively above a key descending trendline near the $2,110-$2,120 zone, triggering an aggressive expansion that pushed price through the $2,200 level with strong momentum. The move was anticipated by Crypto Tony, who flagged the setup ahead of the breakout, noting the precision with which the structure was unfolding.
ETH Completes 5-Wave Corrective Structure Before the Move
The chart shows a well-defined corrective phase marked by a sequence of lower highs and lower lows. Price respected a descending trendline throughout the structure, with multiple failed attempts to break above it.
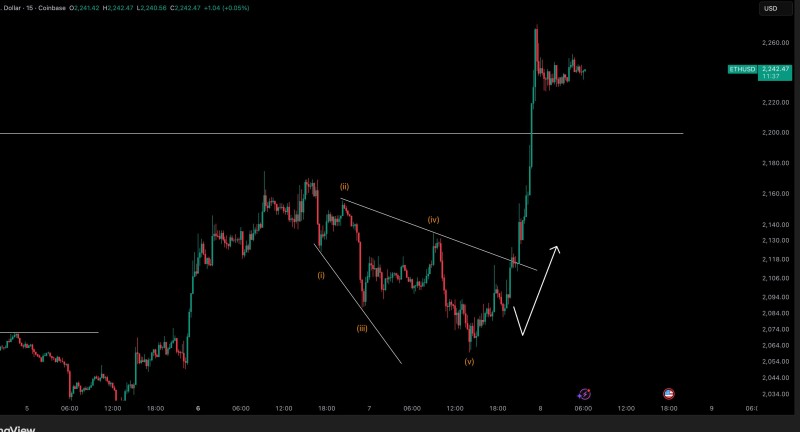
Each bounce was capped beneath resistance, maintaining pressure until the final leg lower formed a local bottom near the $2,060-$2,080 area.
This pattern reflects controlled downside movement rather than disorderly selling. The structure itself - labeled waves (i) through (v) - indicates a completed corrective cycle, which in technical analysis often precedes a sharp directional move. Recognizing these sequences early is what separates reactive trading from anticipatory positioning.
The ETH Breakout That Triggered Expansion Above $2,200
The key technical shift came when Ethereum broke above the descending trendline near the $2,110-$2,120 zone. This level had consistently rejected price, making it a critical barrier for weeks.
Once breached, price moved aggressively higher, slicing through the ETH holds $2,000 as breakout or breakdown nears scenario and accelerating well above $2,200. The breakout did not stall at prior resistance - a clear sign of genuine market control shifting to the upside.
This type of compression below resistance, followed by rapid expansion once that level gives way, is one of the more reliable patterns in technical analysis. Trapped positions unwind fast, and momentum traders pile in almost simultaneously.
This behavior aligns with classic technical analysis principles, where sustained compression below resistance leads to expansion once the level breaks. Similar Ethereum setups have historically produced rapid price acceleration as short positions unwind and buyers gain confidence.
ETH Price Behavior After the Surge Toward $2,250
Following the vertical move, Ethereum stabilized near the $2,230-$2,250 region. The chart shows tight consolidation at elevated levels rather than an immediate pullback - a sign that the breakout is being accepted by the market rather than faded.
The prior resistance zone around $2,100 now acts as support, confirming a structural flip. As seen in previous ETH rebounds from $1,900 but traders stay defensive situations, holding newly claimed levels is what separates a genuine reversal from a false breakout.
The $2,100-$2,150 region has historically acted as a decisive structural level, separating bearish pressure from bullish continuation.
Holding above this zone keeps the short-term structure intact and reinforces the bullish shift visible on the chart. Within broader Ethereum technical analysis, similar patterns have emerged where repeated resistance tests eventually led to breakout expansion once pressure built sufficiently. Those watching ETH stalls below $2,300 as bearish pressure holds will now be tracking whether this momentum can carry price through the next key resistance cluster above $2,300.
 Sergey Diakov