Dogecoin is catching traders' eyes again as a classic bullish pattern takes shape on its chart.
What the Chart Shows
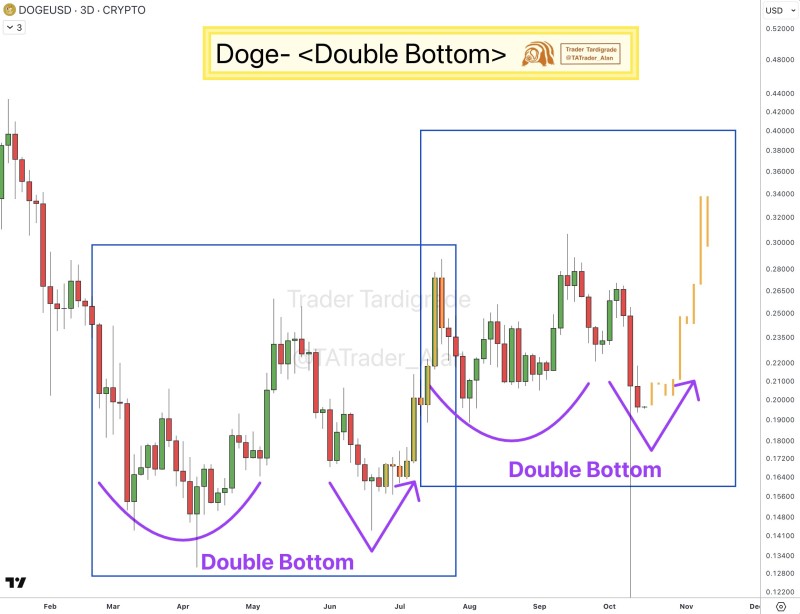
Market analyst Trader Tardigrade recently spotted what looks like a second double bottom formation on DOGE's 3-day timeframe—a pattern that's often a heads-up for upward price movement.

The analysis reveals two double bottom structures worth paying attention to. Back in spring and summer of 2024, DOGE bounced twice off lows around $0.14 before taking off on a strong rally that confirmed the bullish setup. Now, in autumn 2024, we're seeing something similar play out. The price is testing support in that $0.16–$0.18 zone again, forming what could be another launching pad for gains.
If this pattern plays out as projected on the chart, Dogecoin might push toward the $0.30–$0.34 range over the next few weeks. The key support sitting at $0.16–$0.18 is absolutely critical here—if that level holds, it validates the whole double bottom idea. On the flip side, $0.30 is acting as a tough resistance ceiling, but breaking through could open the door to $0.34–$0.38.
Why This Matters
Dogecoin has a track record of explosive rallies after technical breakouts, usually powered by retail traders and social media buzz. If this second double bottom confirms, we could see renewed bullish energy and heavier trading activity flowing into DOGE. That said, there's real risk involved. If the price can't hold above that $0.16–$0.18 support zone, the bullish case falls apart and we could see a drop instead.
This emerging double bottom gives Dogecoin an interesting technical setup. A clean break above resistance could kick off another rally, but everything hinges on holding that key support level. For now, DOGE traders are keeping a close watch to see if this pattern delivers like the last one did.
 Usman Salis

 Usman Salis


