Alex Dudov

⬤ Dogecoin's daily chart is showing a significant momentum shift through the relative strength index indicator. DOGE hit its peak when the RSI was flashing overbought signals, and now it's dropped all the way into oversold territory after the price pullback.
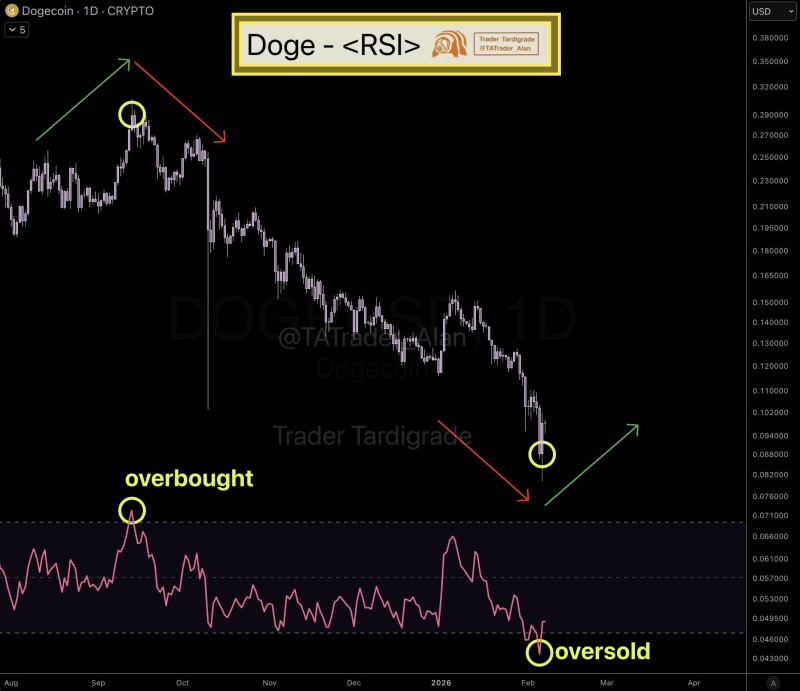
⬤ The chart pinpoints where the RSI previously crossed into overbought zone, which lined up perfectly with the price top. From there, both price and RSI headed south together.
⬤ Current price action puts DOGE at much lower levels, with the RSI now sitting below the oversold line. The contrast between the earlier overbought reading and today's oversold signal couldn't be clearer.
⬤ The indicator has completed a full reversal from one momentum extreme to the other, reflecting completely opposite conditions compared to the previous peak.
 Alex Dudov