Saad Ullah

Dogecoin (DOGE) has consistently caught the market off guard with its explosive price movements. The monthly chart now reveals a familiar structure that mirrors previous cycles, suggesting we might be witnessing history in the making. This recurring pattern raises an important question: is DOGE preparing for another parabolic surge?
Pattern Recognition
Dogecoin's long-term chart structure closely resembles its 2015–2017 cycle. The first cycle saw DOGE consolidate for extended periods before breaking horizontal resistance, which then triggered a massive rally. According to Trader Tardigrade, the current cycle from 2022–2025 shows nearly identical setup characteristics, with price recently breaking through similar resistance levels.
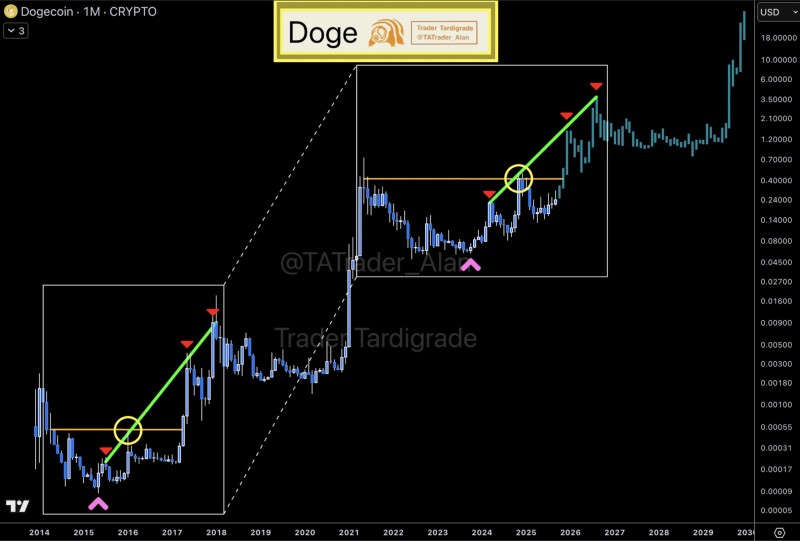
The current cycle from 2022–2025 shows nearly identical setup characteristics, with price recently breaking through similar resistance levels. This visual symmetry between cycles suggests the potential for a renewed bullish phase.
Chart Analysis
DOGE has been establishing higher lows over the past two years, which strengthens the overall bullish perspective. A decisive move above $0.40 could signal the next major upward leg, mirroring the breakout structure from previous cycles. If this fractal pattern continues developing, DOGE might retest the $1 psychological level and potentially push beyond that mark. The monthly RSI indicator shows increasing strength, which supports the underlying bullish thesis.
Supporting Factors
Beyond technical patterns, several fundamental factors continue supporting Dogecoin's growth trajectory. The cryptocurrency is gaining wider adoption in payment systems and tipping platforms, while maintaining strong backing from its dedicated retail community. Additionally, ongoing speculation about potential integration with Elon Musk's X platform continues fueling investor interest and market enthusiasm.
 Saad Ullah