 Saad Ullah

⬤ Dogecoin's monthly price action is reaching a make-or-break moment as it trades close to resistance within a long-term falling channel. The chart shows multiple times throughout DOGE's history where similar rallies into this trendline resistance were followed by aggressive selloffs. The current setup suggests Dogecoin might be gearing up for another sharp drop.
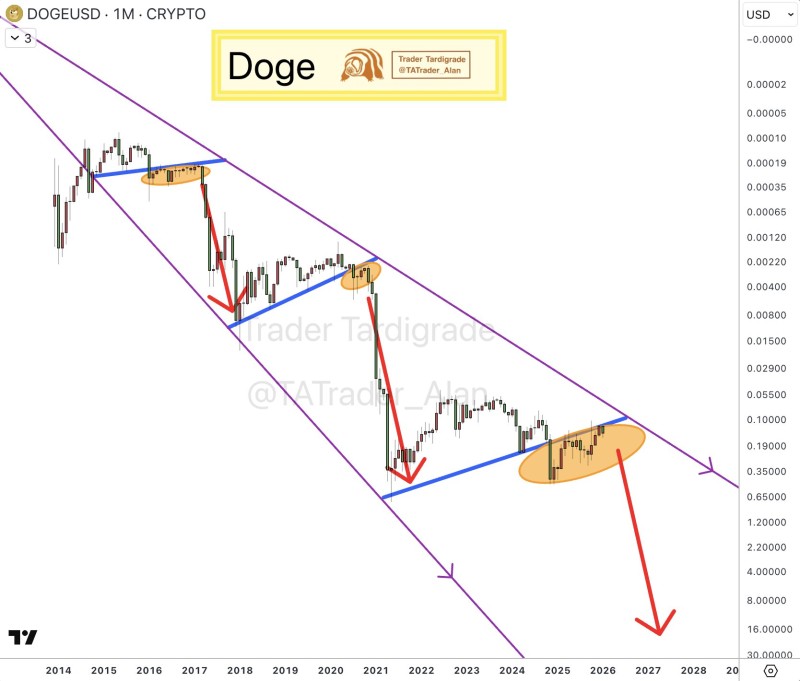
⬤ The chart reveals a recurring pattern going back years in Dogecoin's trading history. Each cycle follows the same script: price climbs toward the upper edge of the descending channel, then breaks down hard and plunges toward the lower boundary. These reversals typically happen after brief consolidation periods near resistance, marked by blue support levels and orange zones, before massive red candles take over. Right now, DOGE's price structure looks remarkably similar to those earlier topping formations.
⬤ In the latest phase, Dogecoin has once again settled near descending resistance after bouncing from lower levels. While the short-term action has calmed down, the bigger monthly picture hasn't changed. Every time DOGE consolidated at similar spots within this channel before, it eventually broke lower instead of pushing higher. The chart shows no signs of a confirmed breakout or trend reversal, which keeps the long-term bearish outlook intact.
⬤ This technical setup matters beyond just DOGE itself because Dogecoin often acts as a sentiment gauge for the crypto market's speculative side. When DOGE makes big moves, meme coins and other high-risk digital assets typically follow suit. With price still trapped under a multi-year downtrend and historical patterns showing brutal selloffs from these zones, how Dogecoin behaves here could shape volatility and sentiment across the entire speculative crypto segment in the near term.
 Saad Ullah


