 Saad Ullah

Dogecoin ($DOGE) is sitting at a crossroads. For four straight weeks, the meme coin has been stuck around the 0.5 Fibonacci retracement level at $0.1919—a price zone that's been significant for the past two years.
What the Chart Shows
According to Cantonese Cat, this drawn-out test is happening on practically no volume, meaning most traders are sitting on their hands, waiting to see which way things break. The chart shows DOGE trapped in a tight range, but history tells us that low volatility at key levels often comes right before a sharp move in one direction or the other.
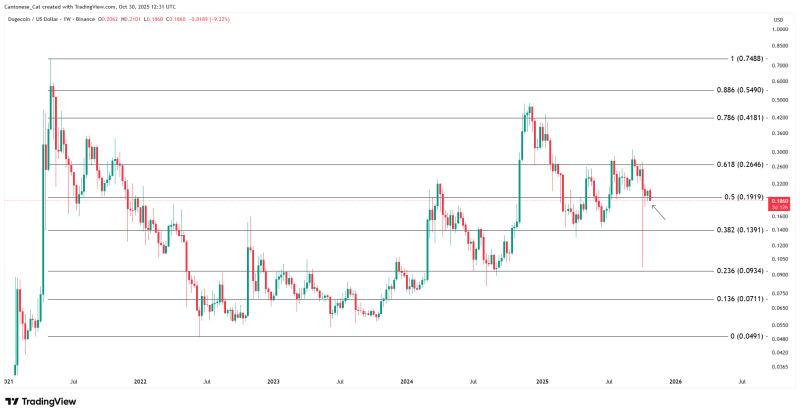
The weekly DOGE/USD chart on Binance shows the coin hovering between $0.19 and $0.20—right at that 0.5 Fibonacci level pulled from the 2021–2025 price structure. DOGE has been bouncing around this zone for nearly a month with no clear momentum either way. Here's what stands out:
- Support at $0.1919: This 0.5 Fibonacci level is getting tested for the fourth consecutive week—a clear tug-of-war between buyers and sellers
- Resistance at $0.26: The next real barrier sits at the 0.618 Fibonacci level, which rejected DOGE during its last bounce attempt
- Downside risk at $0.14: If DOGE closes below $0.18 on the weekly, the 0.382 retracement around $0.139 could be next, confirming a deeper pullback
- Volume is dead: Trading activity has dried up, showing a lack of conviction—often a sign that volatility is building up beneath the surface
- Trend remains flat: Since mid-2022, DOGE has been moving sideways in a broad range with no clear direction
Long lower wicks around $0.18 show some buying interest, but the inability to close above $0.20 suggests bulls are losing steam.
What's Changed in the Broader Market
DOGE's sleepy price action reflects the overall cooldown in meme coin hype. Even with Bitcoin holding steady near $66,000 and AI crypto narratives gaining traction, Dogecoin hasn't captured much attention. Trading volumes have dropped significantly, and social media buzz—usually a big driver for DOGE—has quieted down. Without Elon Musk tweets or other catalysts to stir things up, DOGE lacks the momentum that fueled past rallies. This is a far cry from early 2024, when DOGE doubled in just weeks on renewed market enthusiasm.
Technically, DOGE looks like it's coiling. Tight consolidation on low volume at a key Fibonacci level often acts as a spring—compression before expansion. If DOGE can close a weekly candle above $0.20, it would signal a sentiment shift and open the door to $0.26. But if it loses $0.18, we could see a quick drop to $0.14, where previous support converges with the 0.382 Fibonacci level—historically a spot where long-term buyers step in.
Momentum indicators like RSI and MACD are neutral, neither oversold nor overbought, confirming that DOGE is in a holding pattern.
For now, it's a waiting game. Dogecoin is parked at an important technical level, but without a catalyst or volume spike, traders are reluctant to commit. Long-term holders might see the $0.18–$0.19 range as a decent accumulation zone, especially if Bitcoin stays stable and crypto sentiment improves heading into November. Short-term traders will likely stay sidelined until a confirmed breakout offers clearer risk-reward setups.
One thing's for sure—DOGE has a history of explosive moves after long quiet periods. And this setup is starting to look like one of those calm-before-the-storm moments.
 Saad Ullah


