 Saad Ullah

Dogecoin ($DOGE) may be gearing up for a bounce after several days of pullback. Technical indicators on the 4-hour chart are starting to favor the bulls, with a hidden bullish divergence forming on the RSI and a bullish stochastic RSI cross appearing in the oversold zone.
Hidden Bullish Divergence Signals Strength Beneath the Surface
In his recent analysis, Trader Tardigrade noted that Dogecoin is displaying a hidden bullish divergence on the Relative Strength Index (RSI)—a pattern where price makes a higher low while the RSI makes a lower low. This typically signals continuation of an uptrend, meaning the recent dip might just be a correction rather than a full reversal. On the chart, DOGE has formed a higher low around $0.192 compared to its late-October bottom near $0.186, hinting that buyers are quietly stepping back in.
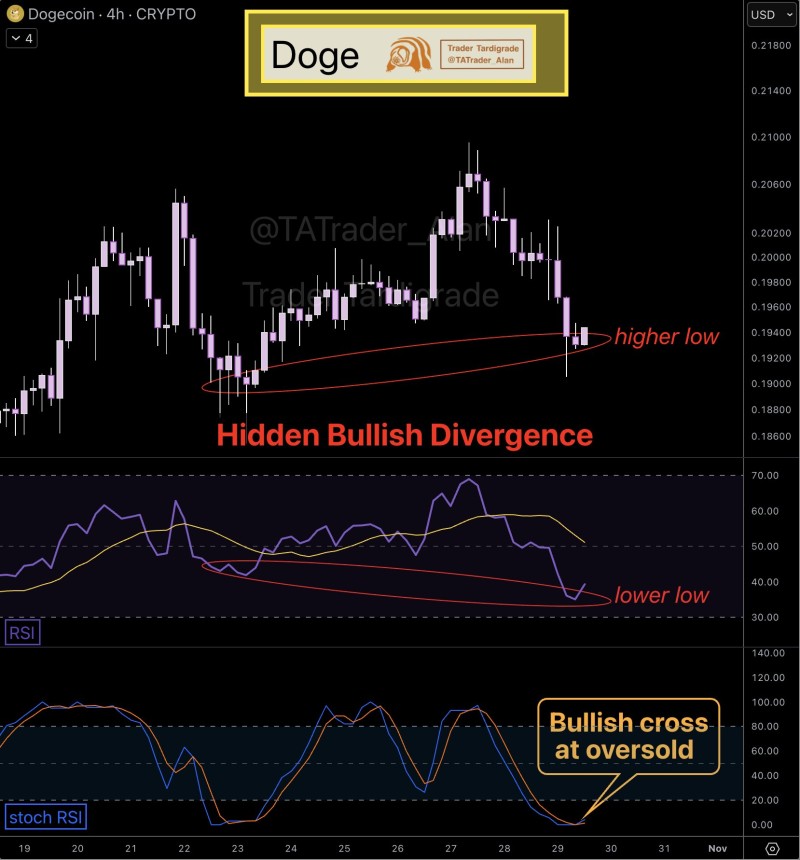
Chart Setup: Oversold Momentum Meets Support
The 4-hour chart shows DOGE bouncing off its trendline support zone, which connects recent lows with a gentle upward slope. The RSI dipped into oversold territory before turning back up, confirming the divergence. Meanwhile, the stochastic RSI just formed a bullish cross at the oversold level—a sign that momentum may be flipping from sellers to buyers. Historically, when these signals align, Dogecoin has often seen short-term rallies.
Key Technical Levels:
- Support Zone: $0.188 – $0.192 (higher low and short-term base)
- Immediate Resistance: $0.202 – $0.205 (previous local top)
- Upside Target: $0.210 – $0.215 (range high and major resistance)
If the $0.192 support holds, DOGE could push toward $0.21 in the coming sessions.
While Bitcoin and Ethereum have been trading sideways lately, Dogecoin has stayed relatively steady. The fact that it's holding higher lows on both 4-hour and daily charts suggests quiet accumulation is happening despite modest volumes. This setup resembles past conditions where DOGE rebounded 8–12% after RSI divergences.
With both the RSI divergence and stochastic crossover now confirmed, traders are watching for a breakout above $0.205. That move would likely kick off a new short-term uptrend and open the path to higher targets. On the flip side, a drop below $0.19 would invalidate the setup and suggest buyers have lost control. But for now, momentum indicators point to a recovery already underway.
 Saad Ullah


