Alex Dudov

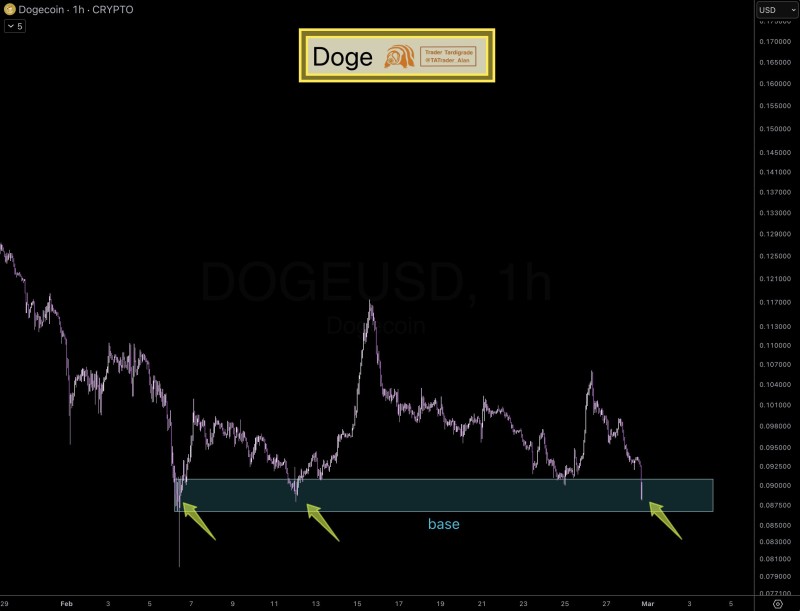
⬤ Dogecoin has come back to a critical support zone on the hourly chart, sitting between $0.087 and $0.091. The DOGE 1h chart shows a shaded "base" region where price has found support multiple times, with arrows marking each earlier reaction. This kind of repeated testing rarely happens by accident — it reflects genuine buying interest at this level and makes the zone technically relevant for any short-term read on the coin.
⬤ DOGE dipped back into the base after a rally that briefly pushed price above $0.10. The same dynamic played out in recent coverage of a liquidity sweep into the $0.09-$0.10 daily support zone, where Dogecoin reacted after tagging a high-demand area and then pulled back. The behavior keeps repeating, which tells you the market respects this floor for now.
⬤ Analysts have also flagged intraday spikes toward $0.105 followed by quick rejection back below $0.10 — a pattern that mirrors what the hourly chart shows right now. Failed breakout attempts keep recycling price back into this same support band, and with large token clusters forming support near the $0.08 region, the structural floor beneath current price looks stacked.
⬤ If the $0.087-$0.091 area keeps attracting buyers, DOGE could continue grinding sideways or stage a bounce toward nearby overhead resistance. A breakdown below this zone, however, would shift the short-term picture and open the door to the deeper demand area around $0.08. Either way, this base is the key level to watch in the sessions ahead.
 Alex Dudov