Eseandre Mordi

Dogecoin (DOGE) daily chart is showing a technical setup that looks remarkably similar to one that appeared before a strong price surge earlier this year. If history repeats itself, DOGE could be gearing up for another significant move higher.
Recurring Bullish Formation
Trader Tardigrade recently pointed out that Dogecoin's current structure closely resembles a pattern seen before its last major rally. The Descending Contracting Wedge typically shows up during consolidation after a sharp decline. The chart displays three touches on the lower trendline and two on the upper one — a classic sign that downward pressure is weakening.
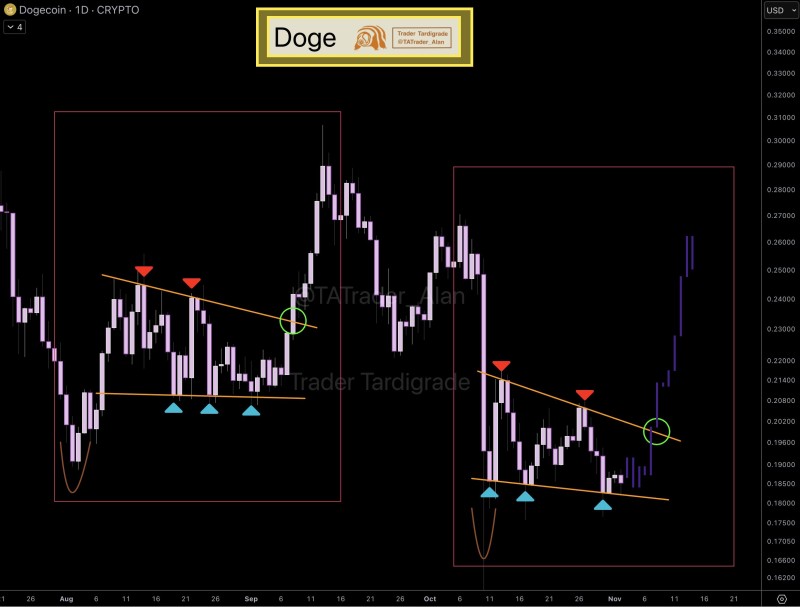
The comparison between the two phases reveals striking similarities. Both started after a steep drop, followed by base-building, tightening price action with lower highs, repeated bounces from support, and finally broke out with strong upward momentum. The current setup shows Dogecoin regaining upward momentum, mirroring the earlier pattern that led to a rally toward $0.27.
What's Next
This pattern is forming as sentiment across the crypto market improves. Bitcoin's stability and renewed interest in altcoins have helped lift speculative coins like Dogecoin, which continues to draw strong retail engagement.
Traders are watching for sustained momentum and rising volume to confirm the setup. If the move holds, potential resistance zones sit near $0.23, $0.26, and eventually $0.30. A drop below $0.18 would undermine the pattern and delay bullish continuation.
 Eseandre Mordi