Saad Ullah

Dogecoin (DOGE) has triggered a bullish signal on the Bollinger BandWidth (BBW) indicator, pointing to potential volatility expansion that could drive the price higher.
Technical Setup
Market analyst Trader Tardigrade recently noted this setup on the daily chart, highlighting that similar patterns have historically led to strong rallies. With price consolidating near key support levels and technical indicators aligning, traders are watching closely for signs of a breakout.
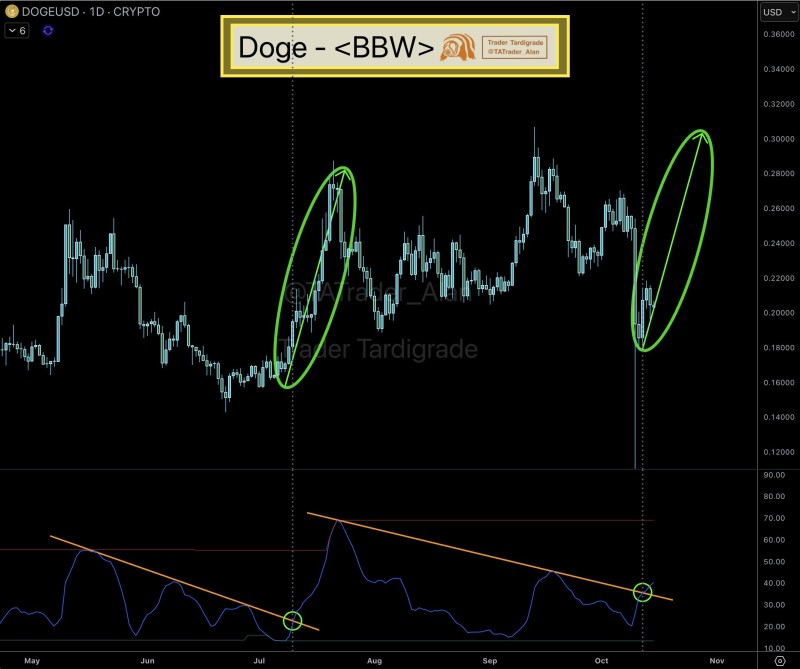
The current chart reveals several compelling factors. The BBW indicator, shown below the price action, has broken out from its downtrend—a shift marked by compression giving way to potential expansion. This pattern has appeared twice before on DOGE's chart, and both instances preceded rapid price surges from below $0.20 to above $0.30. Right now, the price is consolidating near $0.20 after bouncing from recent lows, with the technical structure suggesting this could be the early stage of a new upward cycle. Key resistance sits at $0.26–$0.28, where previous rallies stalled, while a decisive move above $0.30 could open the door to further gains.
Market Context
Meme coins like Dogecoin tend to move in sharp bursts driven by momentum and sentiment, making technical setups like the BBW particularly relevant for attracting speculative interest. Recent on-chain data shows signs of revival in trading volumes and social media activity around DOGE, which often amplifies technical signals. Meanwhile, as Bitcoin consolidates near critical levels, altcoins such as Dogecoin are drawing renewed attention from traders hunting for volatility and quick gains.
If history repeats, Dogecoin could be gearing up for another explosive move. The critical zone to monitor is $0.26–$0.30—bulls need to push through and hold above this range to confirm the breakout. Failure to do so risks keeping DOGE trapped in its broader sideways pattern, but a successful break could send the token toward the $0.35–$0.40 range. The Bollinger BandWidth signal is flashing green, and past patterns suggest this could mark the start of a volatility-driven surge. While resistance levels pose real risks, the setup has technical traders on high alert for a potential breakout.
 Saad Ullah