 Saad Ullah

Dogecoin has been taking a beating lately, but the chart might finally be hinting at a turnaround.
What the Chart Is Showing
Trader Waleed Ahmed recently pointed out a bullish divergence forming on the 4-hour timeframe—a classic signal that downside momentum is weakening. Combined with a harmonic pattern completion near key support, DOGE could be gearing up for a short-term relief rally if the setup confirms.
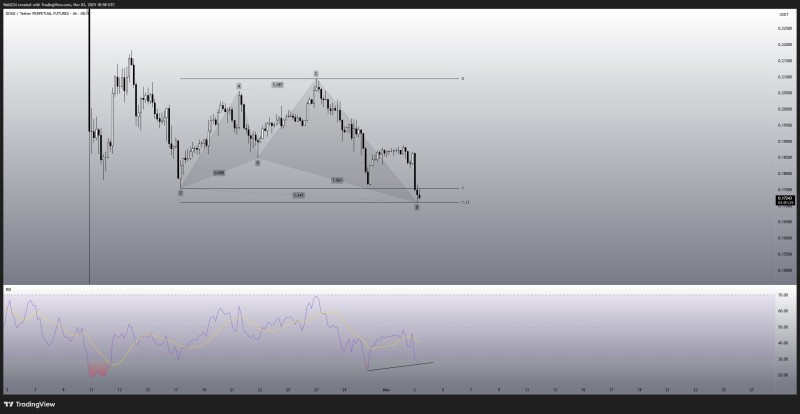
The 4-hour chart reveals a harmonic structure (X–A–B–C–D) with the final D leg completing around $0.174, right where previous support kicked in. Here's what stands out:
- Pattern completion at the 1.13 Fibonacci extension—a common reversal zone
- Support holding between $0.172–$0.175, a level that's worked before
- Declining volume on the way down, suggesting sellers are losing interest
- RSI bullish divergence: while price made a lower low, RSI made a higher low—typically a sign the selling is exhausted
The RSI is hovering near 30–35, flirting with oversold territory, and its moving average is starting to flatten. Past setups like this have led to 10–20% bounces in the short term.
What's Next?
DOGE traders are watching two key levels. If the coin breaks and holds above $0.182–$0.185, that would confirm the reversal and open the door toward $0.195–$0.200. But if it closes below $0.170, the pattern falls apart and DOGE could slide toward $0.160–$0.155.
The current setup leans bullish—harmonic completion plus RSI divergence is a solid combo—but confirmation through volume and a move above short-term resistance is still needed.
Dogecoin is testing a technical bottom, and the chart is giving off reversal vibes. The harmonic pattern at $0.174 and bullish RSI divergence suggest buyers are quietly stepping back in. If DOGE can close above $0.182, a short-term recovery could be on the table. If it fails to hold $0.170, though, the bullish case is off.
 Saad Ullah


