Victoria Bazir

⬤ Dogecoin just broke out from a descending broadening wedge on the 4-hour chart, shifting the technical setup. The breakout happened right as momentum signals started turning positive.
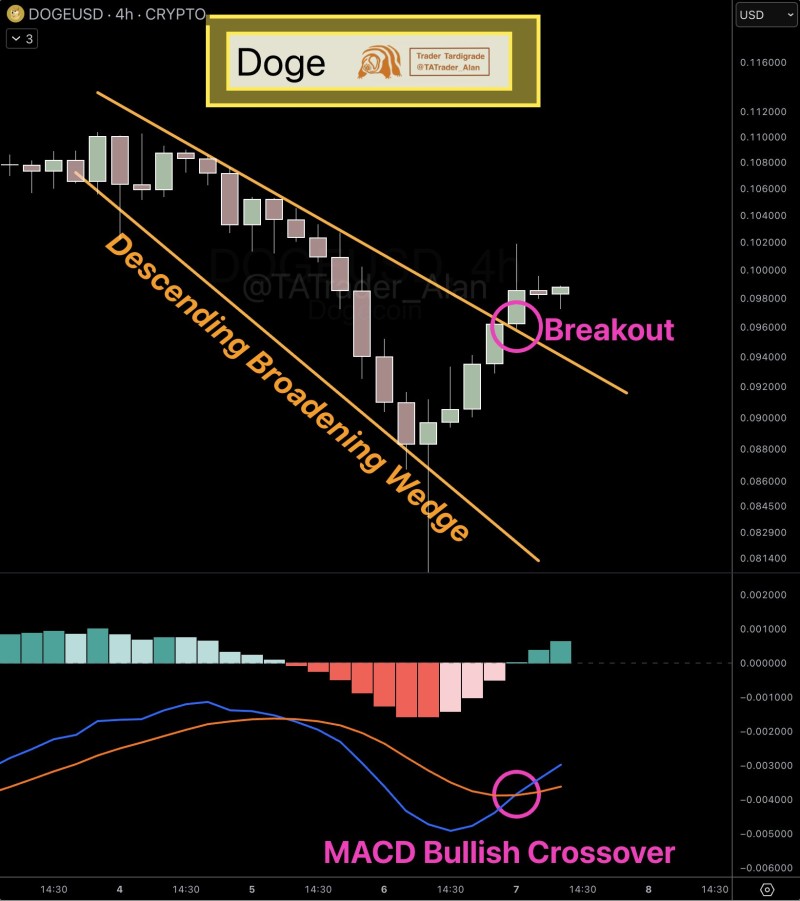
⬤ The chart showed DOGE making lower highs and lower lows inside the wedge before finally punching through the upper resistance line. After breaking out, the price settled around $0.09 to $0.10, marking a clear shift from the previous downtrend.
⬤ The MACD indicator flipped bullish right after the breakout, with the faster line crossing above the signal line. This crossover confirms growing short-term momentum behind DOGE's move.
⬤ What happens next around this breakout zone matters. If DOGE holds above the broken resistance, the bullish momentum stays alive. But if price slips back inside the wedge, the breakout fails and the pattern loses validity.
 Victoria Bazir