 Marina Lyubimova

⬤ Dogecoin might be turning a corner on the shorter timeframes. The DOGE 4-hour chart shows both bullish RSI divergence and a confirmed RSI breakout following a recent pullback.
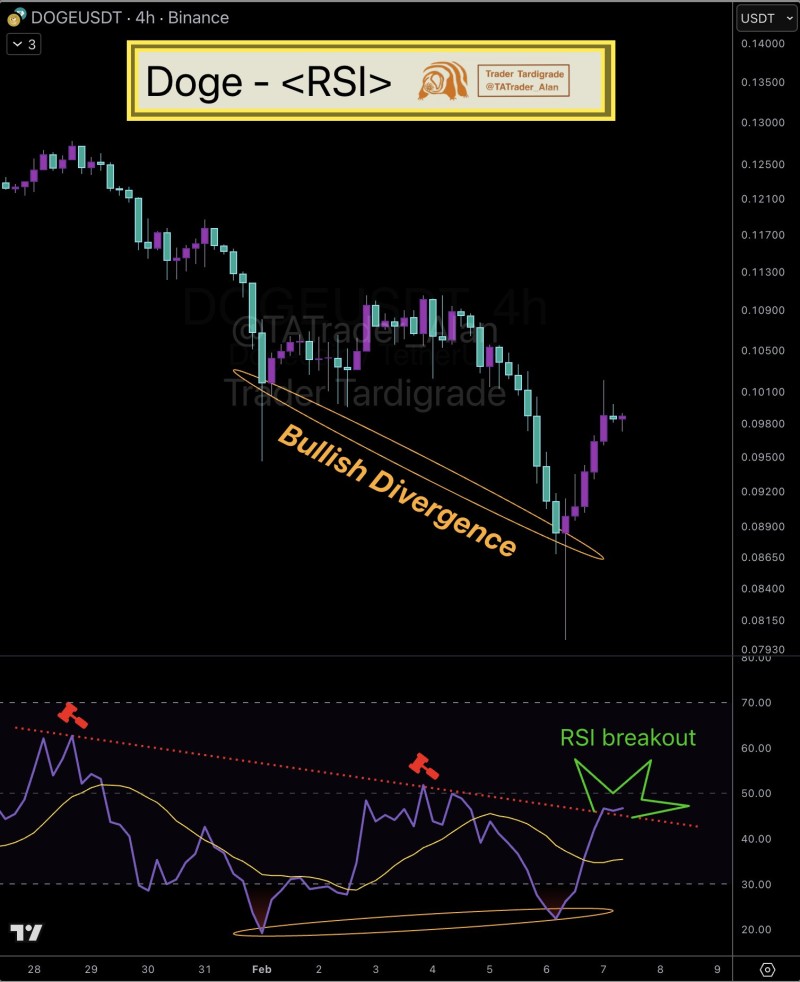
⬤ Here's what's happening: price kept making lower lows while the Relative Strength Index was quietly forming higher lows. This classic divergence pattern usually means sellers are losing steam. Once that divergence showed up, the RSI punched through a descending resistance line—confirming the breakout.
⬤ This combo of divergence plus breakout suggests the short-term market structure is changing. Price bounced right after the signal appeared, showing momentum started stabilizing after the prior downtrend. The real question now is whether this momentum has legs.
⬤ Why does this matter? Momentum indicators like RSI often give you a heads-up before price actually makes its move. DOGE's setup now hinges on what happens next—if the RSI breakout holds and follows through, we could be looking at something bigger than just a quick relief bounce.
 Marina Lyubimova


