Peter Smith

Dogecoin's ratio against Bitcoin is showing an interesting setup right now. After a prolonged slide, the DOGE/BTC pair has stopped accelerating lower and shifted into a tight consolidation pattern that technicians classify as a bullish pennant. It is a subtle but meaningful shift, and one that traders watching meme-coin performance relative to BTC will want to keep on their radar.
What the Chart Is Showing
The selling pressure on DOGE/BTC has clearly faded. The Binance daily chart shows a sharp upward impulse leg followed by converging trendlines, with candles stepping gradually lower inside a triangle rather than collapsing outright. That kind of compression is a classic transition phase between a trend and its next move. It mirrors the broader structural dynamics covered in Dogecoin vs. Bitcoin: 4-Year Chart Pattern Signals Potential Upside Move, where long-term ratio formations have historically preceded relative strength shifts.
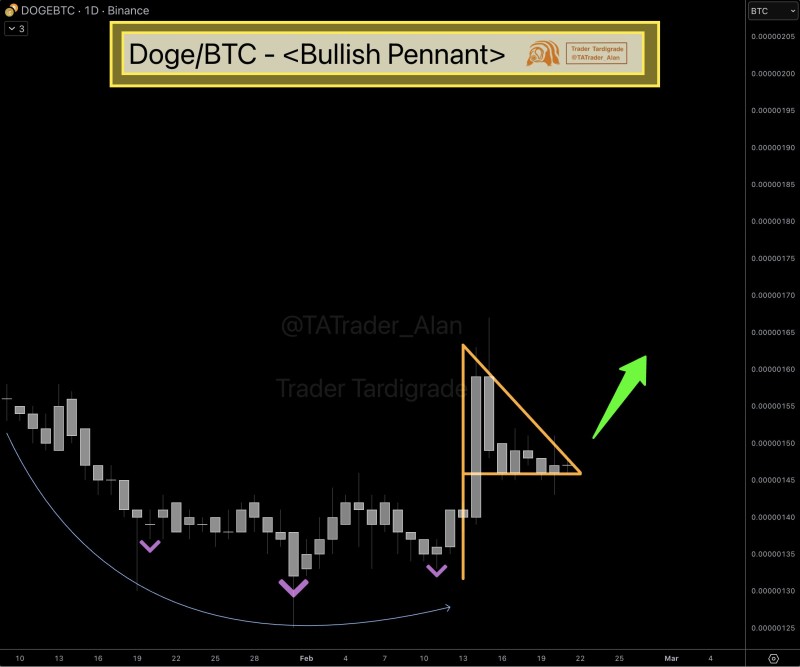
The setup echoes a similar scenario outlined in DOGE Eyes Bitcoin Ratio Breakout: Key Targets Emerge on Long-Term Charts, where tightening price action in the same pair preceded a directional expansion.
Why It Matters for Altcoin Traders
DOGE/BTC is one of the more closely watched gauges of meme-coin health relative to the broader market. If the pennant breaks upward, it would signal that downside pressure has genuinely exhausted itself and that Dogecoin may be positioning for relative outperformance. That kind of BTC-relative strength tends to ripple across altcoins, as explored in DOGE/BTC Shows Strong Momentum as Dogecoin Climbs Higher.
Of course, confirmation is everything with patterns like this. A failure to break out would keep the pair stuck inside consolidation and leave the directional outlook unresolved. For now, the structure is constructive, but traders should wait for price to actually exit the compression zone before drawing conclusions.
 Peter Smith