 Usman Salis

⬤ Dogecoin's showing a notable long-term technical pattern as it continues tracking an ascending channel on the monthly timeframe. DOGE has already completed two upper deviations earlier in the cycle, and now it's forming a lower deviation near channel support—keeping the staircase-like pattern intact and showing that the broader structure is holding steady.
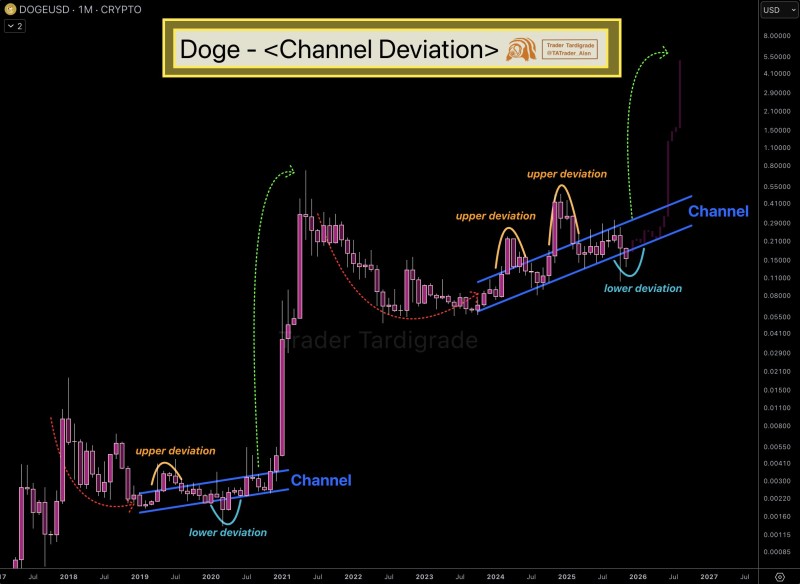
⬤ The chart shows how DOGE has historically bounced between upper and lower deviations before entering major expansion phases. In previous cycles, when Dogecoin briefly shot above the upper channel boundary, it acted as a temporary deviation before price pulled back inside the trend. This happened twice during the current cycle, creating clear upper deviations before DOGE shifted back toward mid-channel levels. The new lower deviation forming now mirrors earlier accumulation periods from past cycles. The long-term channel remains the dominant structure, and DOGE's still trading within its boundaries.
⬤ The visual projection suggests DOGE could potentially move toward the upper channel region again if momentum builds—similar to the 2019–2021 pattern, where a prolonged deviation phase eventually led to a steep upside breakout. While the chart doesn't specify exact targets, the pattern indicates Dogecoin's monthly structure hasn't broken and that these deviations often signal trend continuation. The current lower deviation is being marked as a key structural moment in this cycle.
⬤ This setup matters because Dogecoin's broader trend has historically respected this ascending channel, shaping long-term sentiment across the meme-coin sector. When deviation patterns repeat like this, it reinforces confidence in the structure and can influence expectations for future volatility. As DOGE develops this new deviation, the market's watching to see whether price stabilizes along the lower channel boundary or starts working its way back toward the upper region in the coming months.
 Usman Salis


