 Usman Salis

⬤Dogecoin is working to stabilize after some choppy price movement, currently floating just above the $0.0925 mark. DOGE is trying to hang onto its overnight gains while the market builds what looks like solid support around $0.0888. The 30-minute DOGE/USDT chart shows the crypto bouncing back from that support zone and settling near $0.092-$0.093 after a quick rally earlier today.
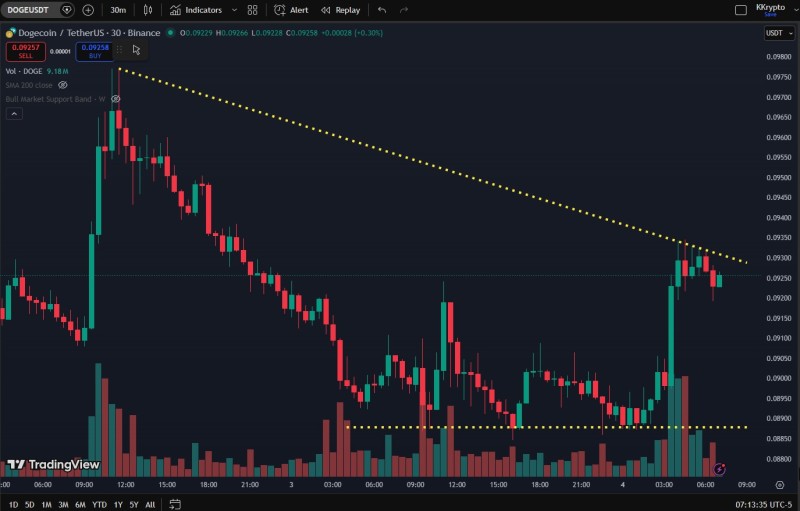
⬤The chart reveals a wider descending trendline running down from earlier highs, suggesting Dogecoin is still facing some short-term technical headwinds despite the recent bounce. Earlier in the session, DOGE was sliding steadily before buyers jumped in around the $0.0888 support region. The latest push toward $0.0925 puts the asset right near that descending resistance line, where it's started consolidating again. We've seen similar setups recently where DOGE found its footing near the $0.09 demand zone after extended drops.
⬤Right now, the price structure shows DOGE trading in a tight range between resistance near $0.0925 and support sitting at roughly $0.0888. Technical patterns like this typically show up when selling pressure starts cooling off and the market takes a breather before making its next move. Similar stabilization patterns appeared during false breakdown attempts, where buyers stepped in around the $0.088-$0.09 area. Additional analysis shows how the $0.09 area has worked as a critical technical foundation during consolidation phases.
⬤Whether Dogecoin can hold the $0.0925 area while defending support near $0.0888 will likely determine where it heads next in the short term. Consolidation around key levels often signals a transition period after a trend move. If the support zone keeps holding, the market might maintain a higher consolidation range near current levels, but a break below $0.0888 would probably reopen downside pressure. How support, resistance, and the descending trendline interact will help shape DOGE's next phase of price action.
 Usman Salis


