Alex Dudov

Dogecoin has been grinding lower for months, with price carving out a steady sequence of lower highs from the previous peak near $0.45-$0.50. A descending trendline has acted as dynamic resistance throughout, capping every recovery attempt before momentum could build. Analysts tracking the setup note that DOGE has been printing lower highs near $0.095, reinforcing the prevailing bearish structure.
Price has settled near a horizontal support zone around $0.09. This level has held repeatedly, preventing further downside and creating a visible floor where selling pressure appears to be stabilizing.
At the same time, that $0.09 zone keeps holding. Sellers have made their move multiple times and come up short - buyers absorb the pressure and price snaps back. That kind of repeated defense is what gives a support level its weight. The combination of falling resistance above and stable support below is the textbook setup for compression - not a reversal, not a breakdown, just a market coiling ahead of its next move.
The $0.30 DOGE Level Returns to Focus
The descending trendline intersects near the $0.30 region, making it the natural technical target if price begins to push higher. Crypto analyst RoccobullboTTom identified $0.30 as the next major area of interest, pointing to the convergence of trendline resistance and prior structure as the key test for any breakout attempt.
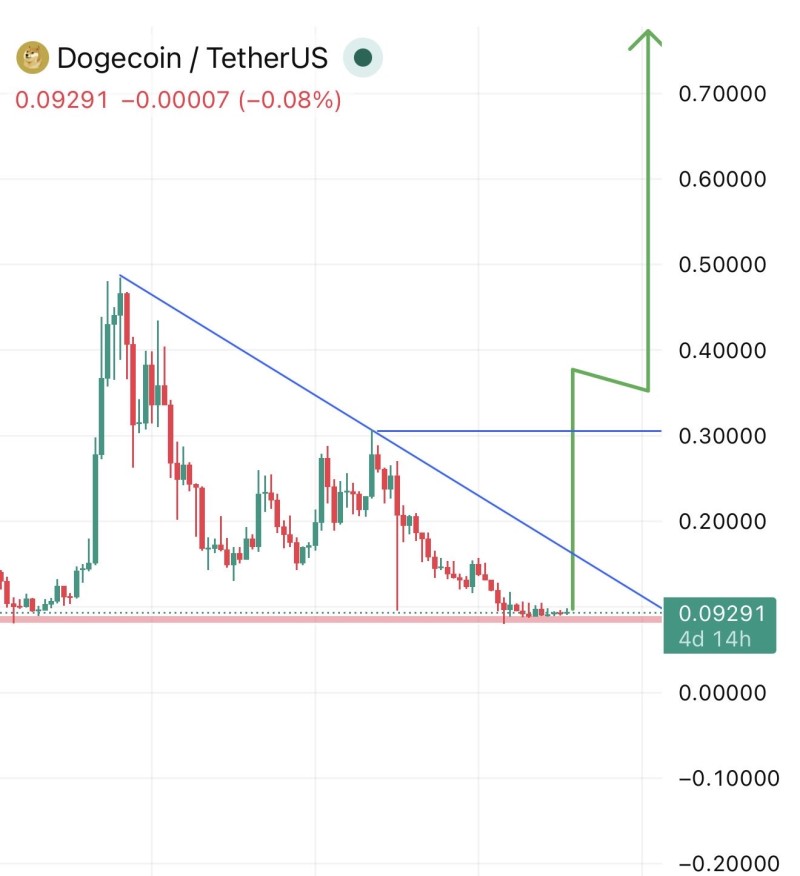
A move toward $0.30 would require a clean break of the descending resistance that has defined this entire downtrend - no partial closes, no wick rejections.
The chart itself does not confirm an immediate breakout. What it does show is price tightening toward a decision point, with each passing session narrowing the gap between support and resistance. That narrowing is the setup. Whether it resolves to the upside or rolls over from here is still open, but the structure is there.
A DOGE Structure Still Defined by Lower Highs
Despite the stability at support, the broader trend remains intact. The market is still operating within a larger bearish framework, and Dogecoin's falling wedge pattern on the 4H chart has kept the bias to the downside until proven otherwise. Key observations from the current structure:
- Lower highs continue to define the downtrend from the $0.45-$0.50 peak
- Price is holding near $0.09 support without a confirmed reversal signal
- Descending resistance remains the dominant structural feature overhead
This is consolidation within a bearish structure, not a confirmed shift into an uptrend. Traders calling for a breakout are speculating on a scenario that still needs confirmation - which is exactly what makes the setup worth watching.
Similar setups have historically preceded directional moves, especially when price compresses between support and descending resistance. In some cases, these phases evolve into breakout patterns once the upper boundary is cleared.
Compression Near $0.09 Signals a Pending DOGE Move
The current positioning reflects a market at equilibrium. Price is no longer falling aggressively, but it has not reclaimed any higher level either. Previous DOGE price analysis highlighting 3 mini cycles pointed to this exact behavior - repeated compression in the $0.09-$0.10 zone followed by sharp expansion - as a recurring pattern across prior cycles.
Longer-term analyses also point to recurring accumulation behavior in DOGE, where extended consolidation phases have preceded sharp rallies in previous market cycles. For now, DOGE remains anchored near support. The next meaningful move will likely depend on whether price can clear the descending trendline and challenge higher resistance - or whether the structure breaks down and the floor at $0.09 finally gives way.
 Alex Dudov