 Usman Salis

⬤ Dogecoin (DOGE) is showing a weekly price pattern that looks remarkably similar to what happened before its Q4 2024 breakout. The current setup has the same structure and timing, with prices moving sideways after a correction. Right now, DOGE is trading in a tight range after dropping earlier, which suggests the market is stabilizing rather than picking a clear direction.
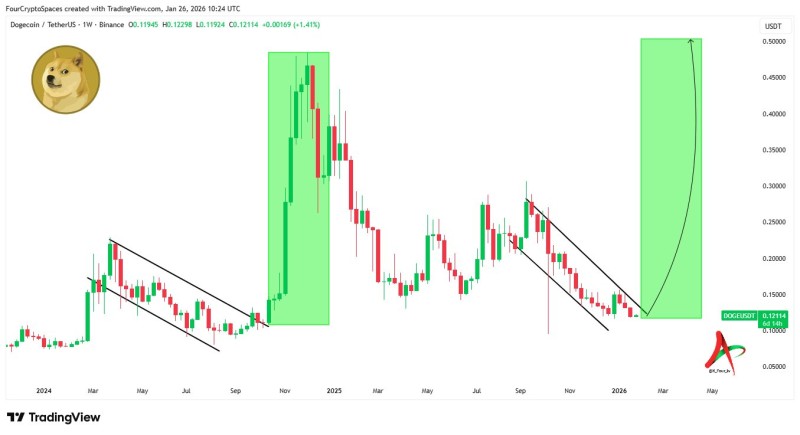
⬤ On the weekly chart, DOGE is consolidating in a downward-sloping pattern, just like it did before the late 2024 surge. Back then, the price stayed stuck in a range for quite a while before finally breaking out. What we're seeing now has the same feel—low volatility, overlapping candles, and that typical look of accumulation rather than trending.
⬤ Looking at the comparison, the earlier breakout only happened after weeks of sideways trading. Both times, the market hit pause after some volatility and built a base. The chart today doesn't confirm a breakout yet—it's still consolidating, which means DOGE is likely in reaccumulation mode rather than actively trending.
⬤ This matters because long accumulation phases often come before big volatility spikes. We don't know yet if DOGE will break higher or lower from here, but the similarity to past behavior has put it back on traders' radars across the crypto market. For now, the focus is on watching how this accumulation plays out rather than betting on any immediate move.
 Usman Salis


