 Saad Ullah

⬤ Dogecoin is flashing a new TD Sequential buy signal as it extends its decline toward the $0.14 region. The last time this indicator appeared, it preceded a massive rebound of about 101.50%. The new signal comes as the three-day chart shows ongoing downward momentum, with DOGE testing key support levels.
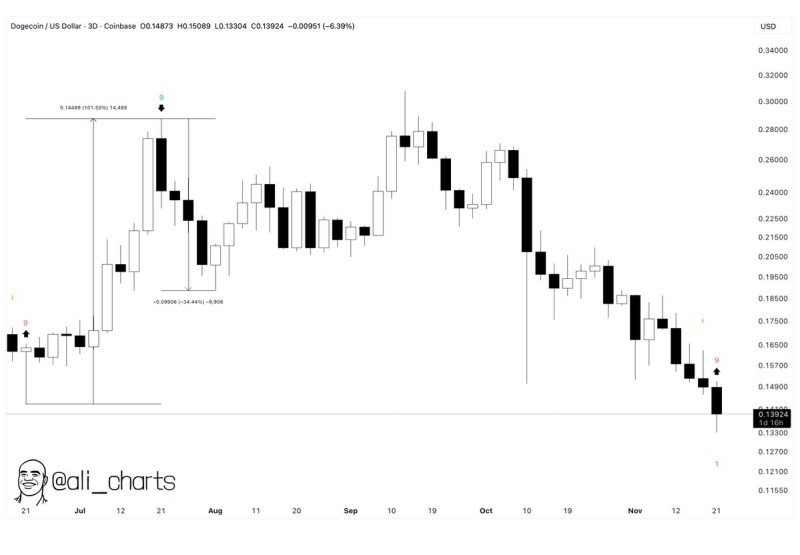
⬤ The chart shows how the previous TD Sequential setup in late June marked the start of a sharp upward move that launched Dogecoin from around $0.072 to nearly $0.148. That surge represented a 101.50% gain before the price reversed and later dropped about 34% as selling pressure kicked in. After that decline, DOGE moved sideways for a while, which cooled volatility and reset key momentum indicators.
⬤ Right now, DOGE is trading near $0.139 after a series of bearish candles, placing the latest TD signal in a similar spot to where it appeared before. The chart reflects persistent weakness throughout October and November, with lower highs and lower lows defining the current downtrend. Still, TD Sequential buy signals often highlight potential exhaustion points in the trend, suggesting the possibility of a short-term bounce if market conditions stabilize.
⬤ This matters because repeated TD signals can shift short-term sentiment across the altcoin market. With Dogecoin approaching historical demand zones while this recognized reversal indicator reappears, traders are watching to see if the pattern triggers another momentum shift like it did in previous cycles.
 Saad Ullah


