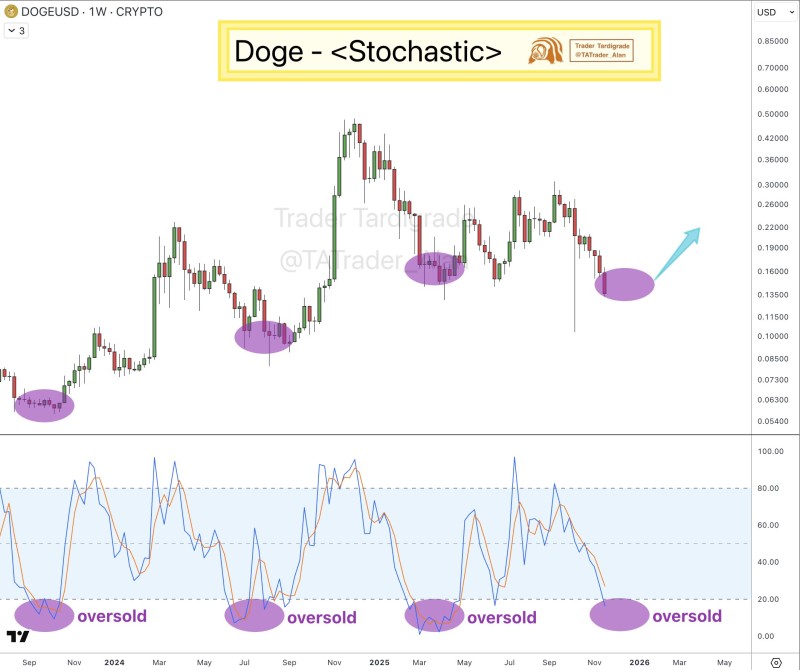
⬤ Dogecoin's weekly stochastic has moved back into the oversold region, marking a point where several previous market lows have formed. The chart shows DOGE trading near the $0.16 level after a multi-month slide from its recent peak. The indicator's repeated alignment with historical bottoms is putting renewed focus on this technical zone.

⬤ The chart highlights a clear pattern where Dogecoin's oversold stochastic readings have consistently matched up with major reversals over the past two years. Each purple-shaded region shows the stochastic dropping to its lower boundary while DOGE's price formed a local bottom shortly after. The current setup looks a lot like these earlier structures, with price stabilizing near a familiar demand area seen across previous cycles. While the broader trend has weakened since mid-2025, the stochastic signal suggests that DOGE might be approaching another potential turning point if history repeats itself.
⬤ Recent price action shows Dogecoin pulling back from the $0.42 region earlier this year into a gradual decline, forming lower highs and lower lows across the weekly timeframe. Candle formations near the current level look compressed, pointing to a slowdown in downward pressure. The stochastic lines continue hovering at the bottom of the range, confirming the oversold environment. In previous instances on the chart, these conditions came before upward recoveries that lasted several weeks, making the present setup worth watching.
⬤ This matters because long-term momentum indicators like the weekly stochastic can shape overall market sentiment when they line up with structural support zones. Oversold readings on higher timeframes often signal trend exhaustion and can influence expectations around volatility and potential directional shifts. How Dogecoin responds compared to earlier oversold patterns could help define the next phase of movement across the broader crypto market.
 Peter Smith

 Peter Smith


