 Usman Salis
Dogecoin has been showing interesting price action lately, with the meme coin settling into a more controlled trading pattern after recent volatile moves. This consolidation phase is catching the attention of technical analysts who see familiar patterns that often precede significant price movements. As DOGE continues to build higher lows while volatility decreases, traders are watching for signs of the next major directional move.
DOGE Price Patterns Show Calm Before the Storm
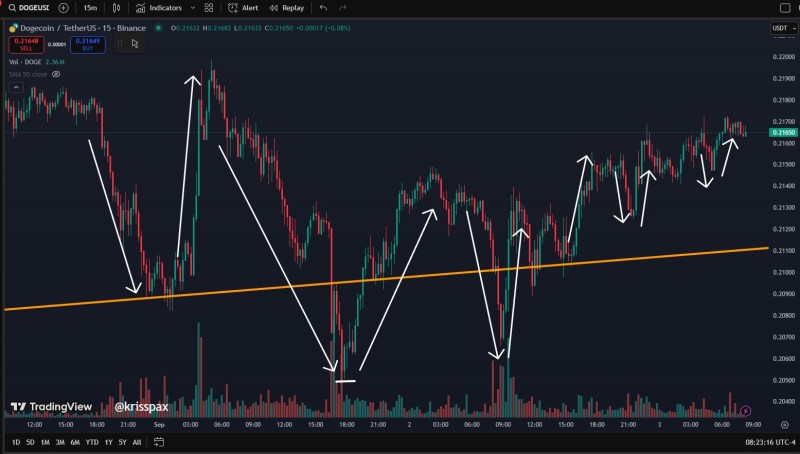
Dogecoin has been trading in a tighter range lately, with price swings getting smaller since Monday. Even though it's been less volatile, the chart shows a clear pattern of higher lows forming along a support line around $0.2110, which suggests people are steadily buying the dips.
Analyst pointed this out in a recent chart, explaining that this kind of behavior usually happens before a bigger move. He noted: "Dogecoin volatility is reduced as the up and down movements are getting smaller and smaller since Monday, while slowly printing higher lows as $DOGE moves up in price. Is this move setting up for a bigger spike? We've seen this before ..."
Key Levels for DOGE Price
- Support: $0.2110 (rising trendline), $0.2090 as backup support
- Resistance: $0.2175 immediate hurdle, $0.2200 key breakout level
- Upside targets: $0.2250–$0.2300 if the breakout happens
The chart shows these shrinking price moves are like a coiled spring - building up energy for a potential sharp move in either direction.
DOGE Price Outlook: Breakout or Breakdown?
If Dogecoin can push clearly above $0.2200, we could see bullish momentum pick up and drive the price toward $0.2250 and higher. On the flip side, if it breaks below that rising support line, DOGE might drop to $0.2090 or lower, showing the bulls have lost control.
The setup looks like a textbook pre-breakout pattern. With volatility shrinking and those higher lows forming, the odds seem to favor an upward move - but smart traders are waiting for clear confirmation before jumping in.
 Usman Salis


