Saad Ullah

Dogecoin (DOGE) recent chart pattern has caught traders' attention. After months of creating higher lows and facing tightening resistance, $DOGE is pushing against a crucial technical ceiling. This structure suggests a decisive move could be coming soon — one that might determine October's price direction.
Dogecoin Daily Chart: Rising Wedge Formation
Dogecoin's daily chart reveals a rising wedge pattern contained by a strong uptrend line from June and a horizontal resistance zone near $0.30. The support trendline shows buyers consistently defending the ascending blue line, currently around $0.24–$0.25, while according to Trader Tardigrade, resistance at the wedge's upper boundary just under $0.30 remains the critical level to overcome.
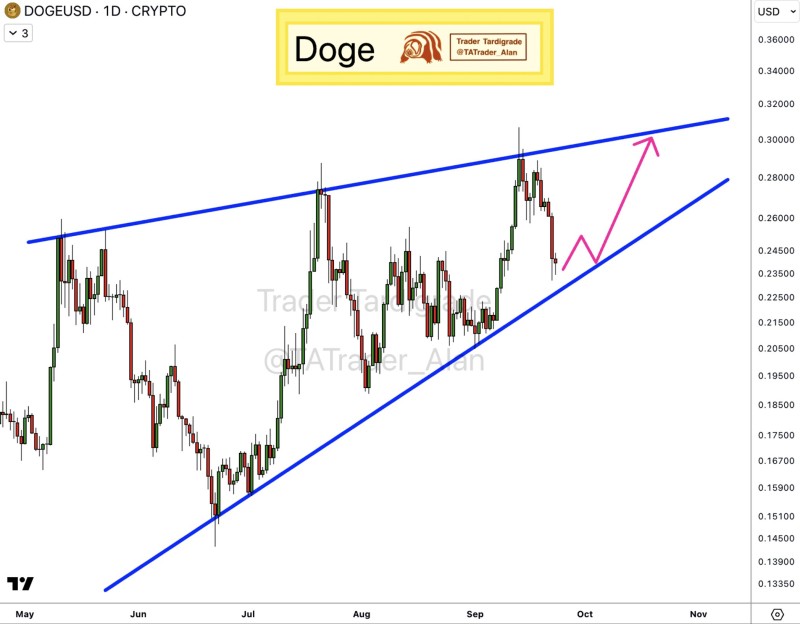
Price action is compressing, and a breakout attempt looks likely in the coming weeks.
Why Momentum Matters Now
The timing appears significant for several reasons. Broader crypto sentiment shows Bitcoin and Ethereum consolidating, which often triggers renewed inflows into altcoins like Dogecoin. The retail hype factor remains strong, as Dogecoin typically thrives on community-driven rallies that amplify moves when technical patterns align. Additionally, rising wedges frequently precede sharp price expansions, making the $0.30 test particularly crucial for future direction.
Bulls Eye $0.30 Breakout
Dogecoin is nearing the final stages of its wedge formation. A decisive close above $0.30 could unlock upside potential toward $0.32 and beyond. However, losing support at $0.24 may trigger a pullback into the lower $0.20s. For traders, the message is straightforward: Dogecoin's next breakout attempt may well define its short-term trend trajectory.
 Saad Ullah