 Usman Salis

Dogecoin has been quietly consolidating in recent weeks, but technical analysts are spotting an interesting pattern that could lead to significant price action. The popular memecoin is currently trapped within a symmetrical triangle formation—a setup that often precedes major moves in either direction. With the pattern nearing its apex, traders are preparing for what could be DOGE's next big breakout.
DOGE Price Forms Symmetrical Triangle
Right now, Dogecoin is stuck inside what's called a symmetrical triangle—basically, the price keeps bouncing between two converging trend lines that are squeezing it into a tighter and tighter range. Trader @TATrader_Alan spotted this setup and pointed out that DOGE is getting close to the tip of this triangle, which usually means a breakout is coming soon.
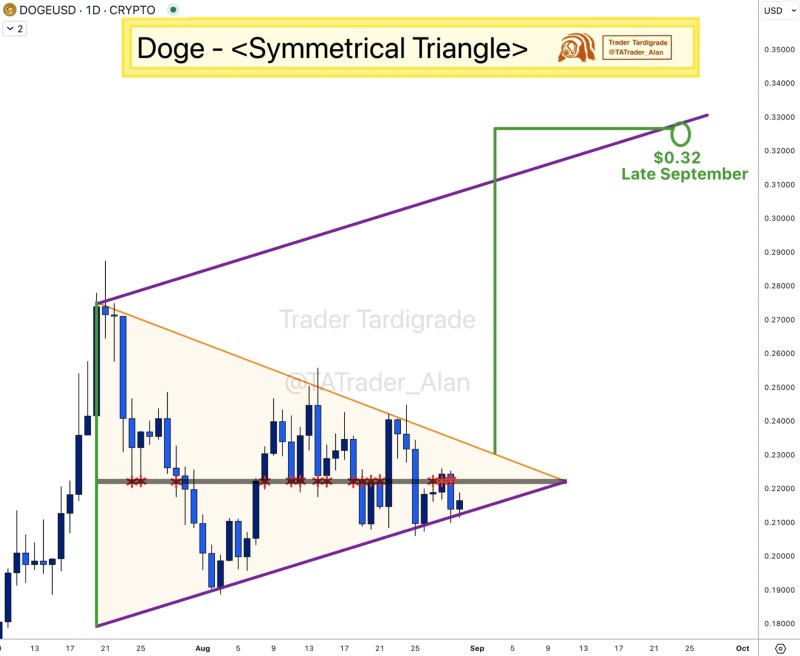
Looking at the daily chart, you can see the price action getting compressed. The coin has been finding support around $0.21–$0.22 and hitting resistance near $0.24. These triangular patterns often continue the previous trend, and with bulls keeping a close eye on things, there's growing anticipation about which way the price will move.
DOGE Price Target: $0.32 by September
If Dogecoin manages to break above that $0.24 resistance level, technical analysis suggests the price could shoot up to around $0.32. That would be a solid 45% jump from where we are now—definitely the kind of move that would get people talking about DOGE again.
This target comes from measuring the height of the triangle and projecting it upward from the breakout point. If it plays out, it would be one of the strongest rallies we've seen from Dogecoin in months, potentially bringing back some of that memecoin excitement.
Of course, there's always a flip side. If the breakout fails and DOGE can't push through resistance, the price could slide back down to test that $0.20 support area. That makes this current level pretty crucial for anyone watching the short-term direction.
 Usman Salis


