 Saad Ullah

⬤ Cardano's ADA has climbed back toward the $0.40 mark, where it's now hitting major resistance after a long downtrend. The token is trading around $0.399-$0.40, right where it meets a downward trend line and an important moving average. This zone has become technically significant, and traders are watching closely to see if ADA can actually push through it or get rejected once again.
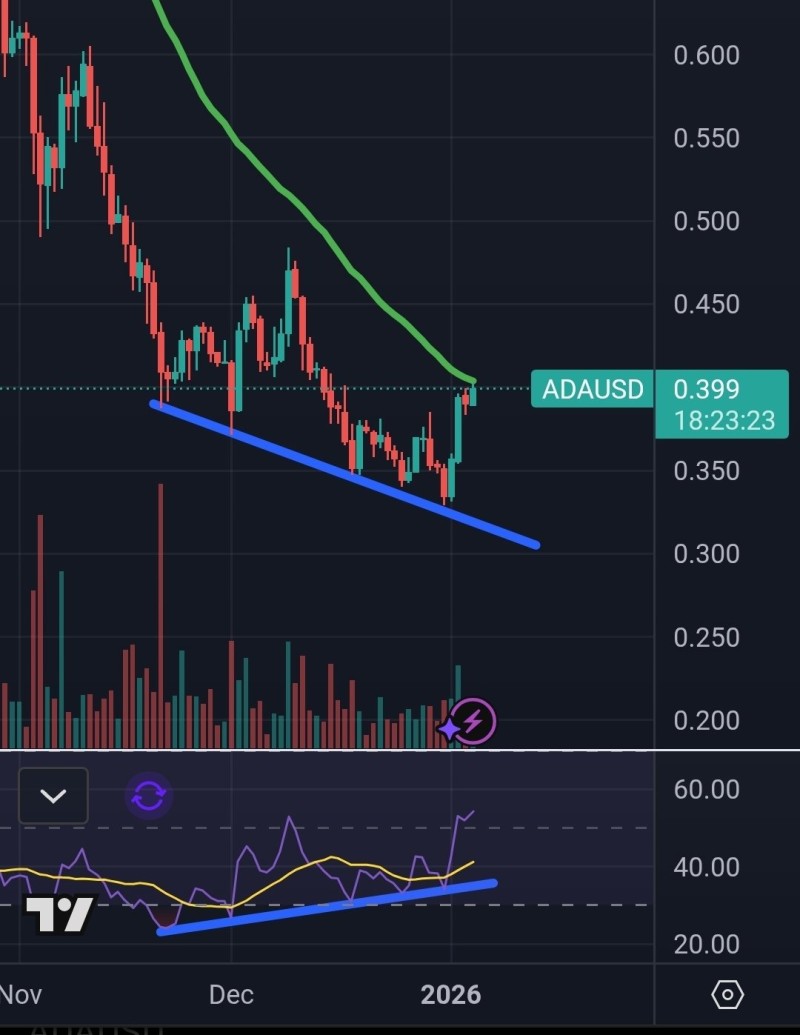
⬤ What's interesting is that while ADA has been making lower lows in price, the RSI momentum indicator has been forming higher lows. This bullish divergence usually means selling pressure is weakening, and that's exactly what we've seen—ADA made a sharp move up into this resistance band. Volume has also picked up slightly during the recent climb, which adds some weight to the rally. "A break above this area could trigger stronger upside momentum if follow through buying emerges," market observers noted.
⬤ The big question now is whether ADA can actually break above $0.40 or if it'll get turned away like it has before. That green moving average line keeps acting as a ceiling, and price is testing it again right now. If ADA gets rejected here, it'll probably head back down to recent support levels. But if it breaks through and holds above $0.40, that would be the first real win against this resistance in weeks—and could shift the whole technical picture.
⬤ The $0.40 level has become both a psychological barrier and a technical pivot point for Cardano. How ADA handles this zone over the next few sessions could determine whether the recent bounce is just another failed rally or the start of something more sustainable. With bullish divergence forming and price action improving, the reaction at $0.40 might be the signal traders are waiting for to gauge ADA's near-term direction.
 Saad Ullah


