Usman Salis

⬤ Bitcoin's price action turned fragile after falling below the $67,000 mark, hinting at a potential shift in the current trend. The next critical support zone sits between $65,000 and $66,000, and if this range fails to hold, a deeper correction could be on the horizon. The chart shows BTC breaking through its previous consolidation base and moving toward a lower liquidity zone where buyers previously stepped in.
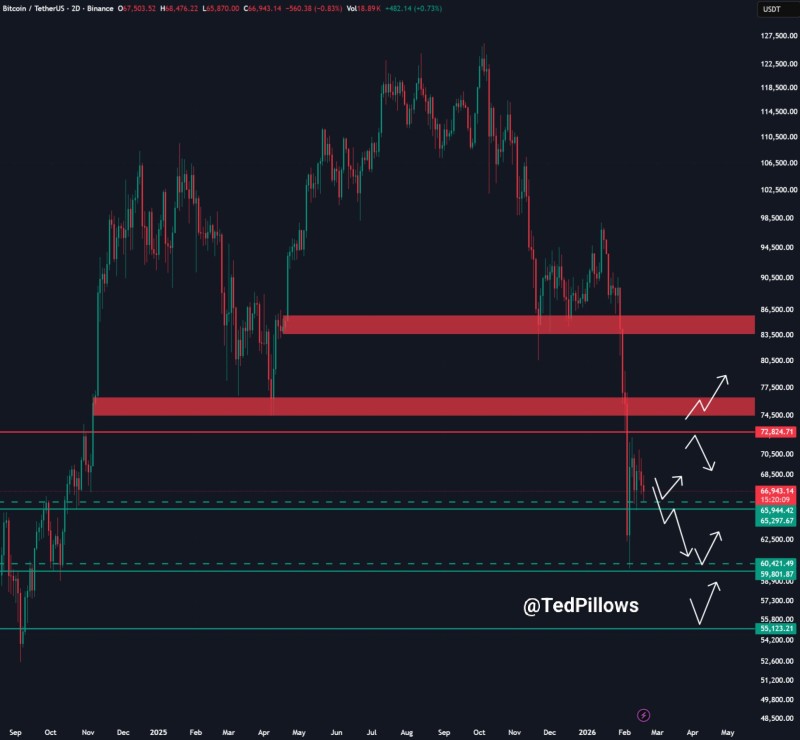
⬤ Right now, Bitcoin appears to be losing the higher-low pattern that's been supporting the broader bullish momentum. When price drops beneath a major support cluster like this, the odds of testing even deeper liquidity areas go up.
⬤ If the current support gives way, the next logical target becomes the $60,000 level, which has historically acted as strong demand. We've seen similar patterns before - BTC loses its structure first, then sweeps lower support zones during volatile phases. Bitcoin weekly recovery after mid-$60K dip shows how the market behaved during the last major dip.
⬤ From a technical standpoint, we're at a decision point. Holding above $65K keeps the range alive and allows for more sideways action, but losing it confirms bearish momentum is building. The zones marked on the chart represent stacked liquidity - meaning once price breaks through, it can accelerate quickly. This breakdown scenario matches patterns where resistance failure leads to extended downside moves. Bitcoin critical $65K resistance scenario outlines similar technical setups.
⬤ This level matters beyond just short-term swings. Market structure shifts typically start with losing a higher-low sequence, then rapid liquidity sweeps follow. If BTC can't quickly reclaim the broken support, broader sentiment may weaken temporarily while traders reassess their positions around major support clusters.
 Usman Salis