 Marina Lyubimova

Bitcoin has stabilized around the $70,000 level following one of its most dramatic price corrections in recent months. After tumbling from late-2025 peaks above $100,000, the leading cryptocurrency is showing signs of recovery, with technical analysts pointing to bullish signals emerging on higher timeframes.
Weekly Candle Shows Strength After $65,000 Low
Bitcoin (BTC) bounced back near the $70,000 zone on the weekly chart after experiencing a steep drawdown from its previous highs. According to crypto analyst Michaël van de Poppe, the current weekly candle formation "looks good" and indicates potential upside movement ahead.
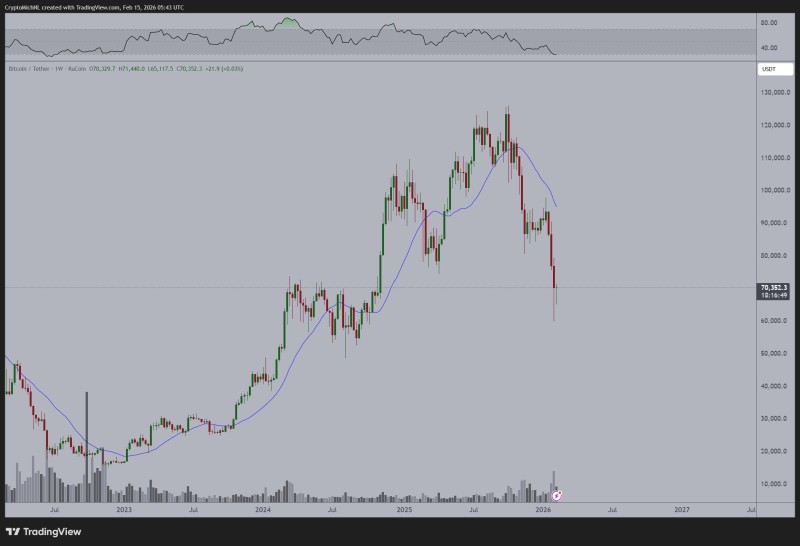
The BTC/USDT weekly chart reveals price action recovering after briefly dipping into the mid-$60,000 range. This week's candle sits near $70,352, having printed a high around $71,440 and a low near $65,118—demonstrating a notable recovery from the selloff despite continued elevated volatility. This pattern reflects holding in a tight range after a sharp drop.
The current weekly candle looks good and points to more upside, with the market potentially testing higher levels before any new lows appear.
Market Consolidation After $100,000 Collapse
The recent price action follows a rapid decline from above the $100,000 region down to the $70,000 zone—visible as a steep vertical drop on the chart before the current bounce materialized. While the post-drop candle structure suggests buyers stepped in at lower levels, the market is still processing the aftermath of this significant downswing.
This type of stabilization after sharp declines has historically occurred during periods when Bitcoin holds within a tight range following major corrections. Similar reset behavior on higher timeframes has been observed when trading inside a weekly consolidation framework.
Why This Weekly Formation Matters
The weekly timeframe stabilization after extreme volatility often establishes the foundation for the next trend phase. If BTC holds above recent lows and continues its recovery trajectory, traders may interpret the weekly candle as technical support for a near-term push toward higher prices before any new directional decision emerges.
However, derivatives positioning could influence follow-through during periods of negative funding while price holds support levels. The coming weeks will reveal whether this weekly candle marks a genuine reversal or simply a pause before further downside testing.
For now, Bitcoin's ability to reclaim and hold the $70,000 psychological level after such a dramatic selloff represents an important technical development that could shape market sentiment heading into the next trading phase.
 Marina Lyubimova


