 Usman Salis

⬤ Bitcoin traded close to a critical technical barrier on Thursday as it approached the yearly open—a price level that's been acting as major resistance. This yearly open remains one of the most important obstacles in the current market setup, and the latest chart shows BTC pushing into this zone after bouncing back from lower support levels.
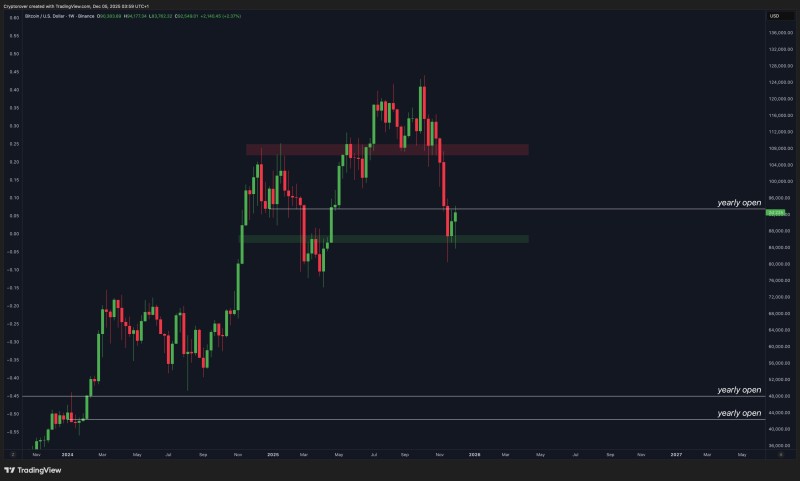
⬤ The chart shows Bitcoin struggling to punch through this resistance area, with several recent attempts ending in pullbacks. The red band above the yearly open marks previous rejection points, highlighting just how significant this level is. Meanwhile, BTC has held strong above the green support zone, showing that buyers are still in the game even though there's clear hesitation around breaking this key resistance.
⬤ With BTC still sitting below the yearly open, the market's showing more consolidation than any clear direction. A clean break above this level would signal a real shift in sentiment and could fuel a stronger bullish move. On the flip side, another rejection here might keep Bitcoin stuck in its current range or even trigger some downward pressure if support starts to crack.
⬤ The yearly open matters because traders treat it as both a psychological and structural benchmark. Whether Bitcoin can finally reclaim this resistance will shape what happens next in the market. Everyone's watching to see if BTC can break through or if we're in for more sideways action.
 Usman Salis


