Victoria Bazir

Bitcoin is entering a pivotal technical phase after a sharp rejection from higher levels, now consolidating around the $70,000-$72,000 range. According to analyst Nehal, while many expect a deeper drop toward $50,000, the current structure points to a potential upside move into the $85,000-$90,000 zone first.
Bitcoin Breakdown Followed by Stabilization Near $70K
The chart shows a clear shift from a prior uptrend into a corrective phase.
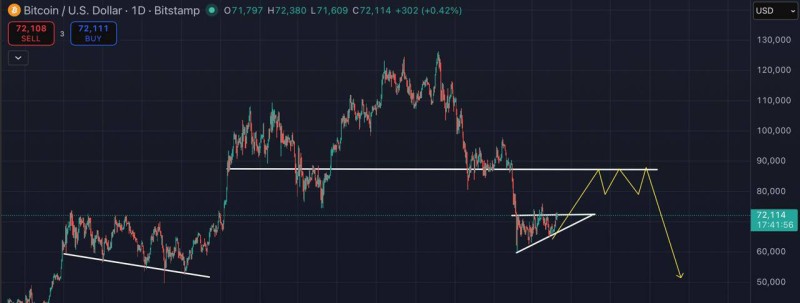
After topping out near the $120,000 region, BTC transitioned into a sequence of lower highs, confirming weakening momentum.
After topping near $120K, Bitcoin shifted into a sequence of lower highs - a textbook sign of momentum fading. The structure now calls for patience before the next decisive move.
A key horizontal level near $88,000-$90,000 stands out as a former support zone that failed during the decline. This level now acts as overhead resistance, aligning with the projected upside path drawn on the chart. Following the selloff, price found footing near the $70,000 area, where volatility has started to compress.
Bitcoin Compression Pattern Forming Below $85K Resistance
Recent price action is tightening into a small ascending structure, marked by rising support and relatively flat resistance. This suggests a short-term consolidation phase rather than immediate continuation lower.
Higher lows are quietly stacking beneath resistance. That kind of building pressure doesn't usually resolve sideways - it tends to push price toward the nearest overhead level before the real direction becomes clear.
The structure reflects a market in balance, where neither buyers nor sellers have taken decisive control. However, the presence of higher lows indicates that buying pressure is gradually building beneath price. This type of formation often precedes a breakout move, especially when it develops after a sharp decline.
The $90K Retest Zone: Key BTC Level to Watch
The projected scenario on the chart outlines a move toward the $85,000-$90,000 region, which coincides with the previously broken support zone. In technical analysis, such areas are commonly revisited as resistance after breakdowns.
The $90K zone is where the market left unfinished business. A return there is not just possible - it may be a necessary step before any sustained move lower takes hold.
This aligns with broader BTC price behavior observed in similar setups, where recovery phases push price back toward key resistance zones before the next directional move unfolds. Recent analysis highlights that the $90,000 level remains a major reference point in Bitcoin price structure and trader positioning.
- Immediate support is holding near $70,000
- Compression builds beneath short-term resistance
- The $85,000-$90,000 zone acts as the primary upside target
If price reaches that zone, the reaction there will be critical. A rejection would reinforce the broader corrective structure, while a sustained break above could shift momentum back toward a more bullish trend. Additional context on positioning can be found in BTC price analysis covering the $94,500 support zone, which outlines how key levels have developed in recent weeks.
For now, BTC remains in a transitional phase, with price coiling just enough to suggest that a larger move - likely driven by a test of overhead resistance - may come before any deeper downside unfolds.
 Victoria Bazir