 Marina Lyubimova

⬤ Bitcoin has been moving sideways after dropping from its late 2025 peaks. The daily chart shows BTC stabilizing above the mid-$90,000 range following a sharp selloff. The market is consolidating as traders wait for clearer signals before making their next moves.
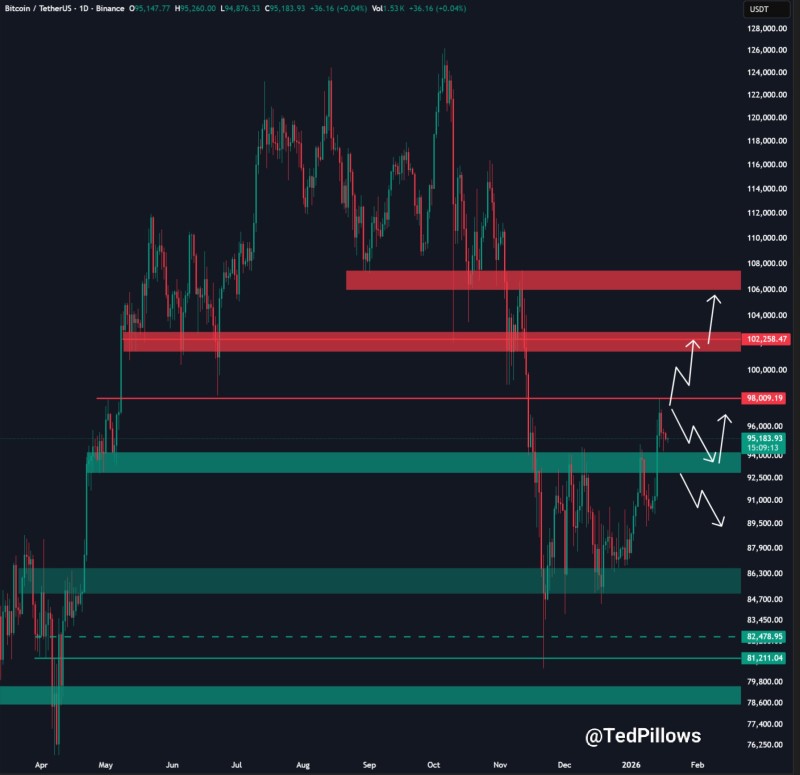
⬤ Several important price zones are marking Bitcoin's current structure. There's a key support band between $92,000 and $95,000 where buyers keep stepping in. Below that, deeper demand zones sit around the low $80,000s, marked by those long lower wicks on the chart where price bounced hard before.
⬤ Looking up, resistance areas are stacked between $98,000 and $106,000. These levels match up with previous consolidation ranges where Bitcoin got rejected earlier. The chart shows possible paths forward—either grinding up toward the psychological $100,000 mark or sliding back down to test lower support if sellers take control. Right now, price action near $94,500 shows indecision, with neither side winning.
⬤ This consolidation matters because Bitcoin usually sets the tone for the entire crypto market. Staying above $94,500 could stabilize things and support a gradual recovery. Breaking below it would put focus on those lower demand zones. With BTC trapped between clear support and resistance, the next sustained move will likely drive direction across digital assets.
 Marina Lyubimova


