 Saad Ullah

⬤ BTC is stuck in what traders are calling a technical holding pattern on the weekly timeframe, with price action grinding along long-term Gann arcs visible on the chart. Bitcoin's currently hovering near $89,000 after pulling back from recent highs above $120,000. BTC remains trapped in what's being described as a "Gann arc jail"—basically an extended period of structural consolidation instead of any clear directional breakout.
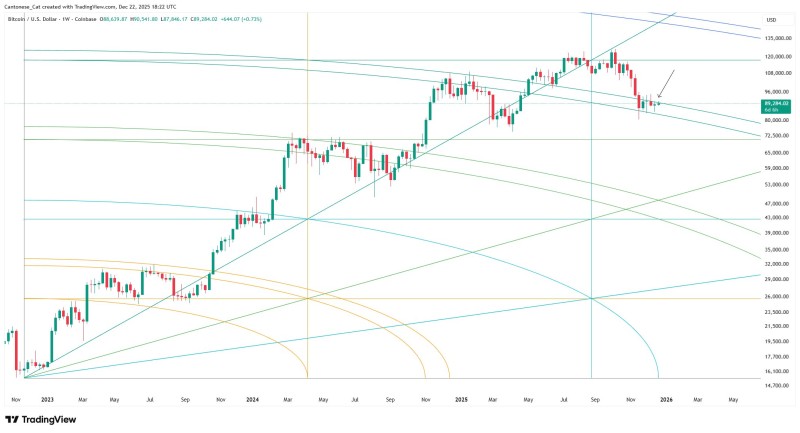
⬤ Looking at the weekly chart, Bitcoin's multi-year rally has been following intersecting Gann arcs and diagonal trendlines that go all the way back to prior cycle lows. After a strong run through 2023 and into 2024, BTC hit the upper portions of this Gann framework before topping out. Since then, price has drifted lower but keeps respecting long-term support, staying locked within the curved geometry that defines where we're trading right now.
⬤ Recent weekly candles show Bitcoin finding some stability after the pullback, with price consolidating along a descending arc rather than accelerating downward. This suggests compression within the broader structure—upward momentum has paused, but there's no strong downside follow-through either. The chart doesn't show a decisive escape from the Gann arc boundaries yet, reinforcing the idea that BTC is still working through a transitional phase in its larger trend.
⬤ Why does this matter? As long as BTC stays supported within the Gann structure, the market's focused on whether this consolidation phase breaks into renewed expansion or just extends into more range-bound movement as the cycle develops. For now, Bitcoin's holding its ground without giving bulls or bears a clear advantage.
 Saad Ullah


