Saad Ullah

Bitcoin is showing a clear technical shift after breaking above a descending trendline that had been defining price action for months. The weekly chart also confirms a bullish MACD crossover, pointing to improving momentum across a longer time frame. According to Ted, this setup could drive a final push toward the $77,000-$78,000 region - a level that carries real structural significance.
For traders watching BTC closely, it is the combination of signals - not any single indicator - that makes this moment worth paying attention to.
This setup could drive a final push toward the $77,000-$78,000 region.
The BTC break that changed structure
The chart clearly shows BTC moving out of a prolonged downtrend, with price breaking above a descending resistance line that had capped rallies for roughly seven months. Before the breakout, Bitcoin was consistently forming lower highs within that structure. The recent move disrupts that pattern entirely, marking a shift from sustained bearish pressure to the early stages of recovery.
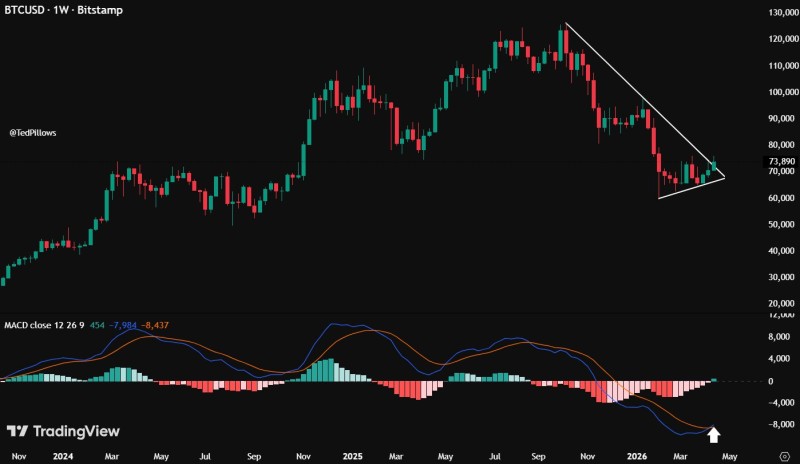
Similar breakouts from descending channels have historically preceded short-term upside extensions in Bitcoin Rejects $68K Range High - What's Next for BTC? At the same time, the lower boundary of the recent structure shows price forming higher lows, reinforcing the idea that purely bearish control is fading.
BTC momentum confirms the shift
The weekly MACD adds another important layer to this setup. The chart shows a bullish crossover in progress, with the histogram beginning to flip positive after an extended bearish phase. This transition suggests that downside momentum is actively fading while buying pressure starts to rebuild underneath the price.
Comparable setups where MACD begins turning upward after consolidation have been associated with early-stage momentum reversals, even if full trend confirmation comes later.
The alignment between the price breakout and the momentum shift strengthens the case for continued upside in the near term. Neither signal alone would be particularly convincing - together, they form a more complete picture. More detail on how this compares to earlier BTC setups can be found in BTC Price Analysis: Bitcoin Eyes $71,700 on $70,900 Reclaim.
The $77K-$78K BTC zone in focus
The chart highlights a projected move toward the $77,000-$78,000 region, which aligns with prior price structure and visible resistance visible on the right side of the chart. Bitcoin is currently trading below that zone, meaning the move is still developing rather than complete. That area represents the next major reaction point - a place where price could encounter meaningful selling pressure.
Recent market behavior has shown that BTC tends to react sharply near well-defined resistance zones, particularly after extended consolidation or trendline breaks. Whether the market can clear $78K cleanly will tell a lot about the strength of the current recovery impulse.
The alignment between the trendline breakout and MACD bullish cross points to a market transitioning from compression into expansion, at least in the short term.
A setup defined by near-term BTC upside
The two core signals - trendline breakout and MACD bullish cross - are both clearly visible on the chart and pointing in the same direction. That kind of alignment does not happen every week. Here is what the setup currently shows:
- Break above a 7-month descending trendline
- Weekly MACD bullish crossover with histogram turning positive
- Price positioned below the $77K-$78K target zone
This combination points to a market transitioning from compression into expansion. Background on how prior MACD crossover setups developed is covered in BTC Price Analysis: Bitcoin 2-Day MACD Nears Bullish Crossover. Whether this move extends cleanly or faces resistance near $78K remains to be seen - but the technical case for near-term upside is now the stronger argument.
 Saad Ullah