 Usman Salis

⬤ Bitcoin continues moving through choppy territory after pulling back from recent peaks, and the pattern looks strikingly familiar to anyone watching the 2020-2021 cycle. The weekly chart shows BTC rejecting from six-figure levels and now holding above a clear support zone around the low-to-mid $80,000 range. Price currently sits near $88,000 after several consecutive weekly drops, showing signs of consolidation rather than capitulation.
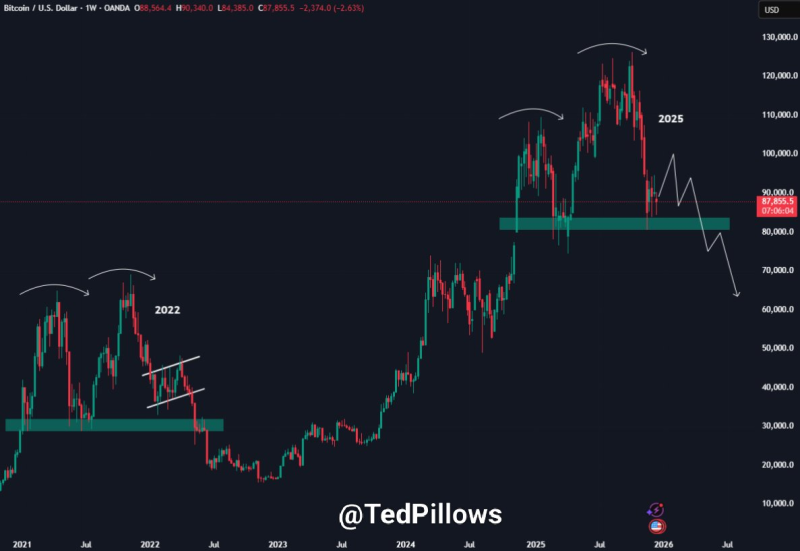
⬤ The chart reveals some interesting historical echoes—rounded tops and corrective waves that mirror the distribution phase from 2021. While BTC has dropped from its 2025 high, it's still sitting above that critical demand zone that previously held during strong upward moves.
⬤ What makes this setup particularly relevant is the dual scenario it presents. On one hand, there's room for a short-term recovery push toward the $95,000-$100,000 psychological resistance zone. On the other, the 2021-2022 comparison serves as a warning—back then, similar breakdowns below horizontal support levels triggered accelerated selling. The projected path suggests significant volatility ahead, with no clear trend reversal confirmed yet since Bitcoin remains below prior local peaks.
⬤ This matters beyond just Bitcoin itself. As the anchor asset for the broader crypto market, BTC's ability to hold or break these technical levels directly impacts sentiment and risk appetite across digital assets. Whether the current support holds or gives way to the historical pattern of extended downside could set the tone for the entire market, especially as traders balance macro conditions against long-term cycle expectations.
 Usman Salis


