Saad Ullah

⬤ Bitcoin (BTC) is trading around $90,066 on Binance's BTC pair, sitting well below the six-figure mark while traders zero in on the long-term 200-day simple moving average (SMA). That indicator is currently sitting near $106,751—a level that matters because BTC touched it during the 2022 cycle before dropping further. Now, if momentum picks up toward this trend level, a rally above $100,000 during Q1 2026 looks increasingly realistic.
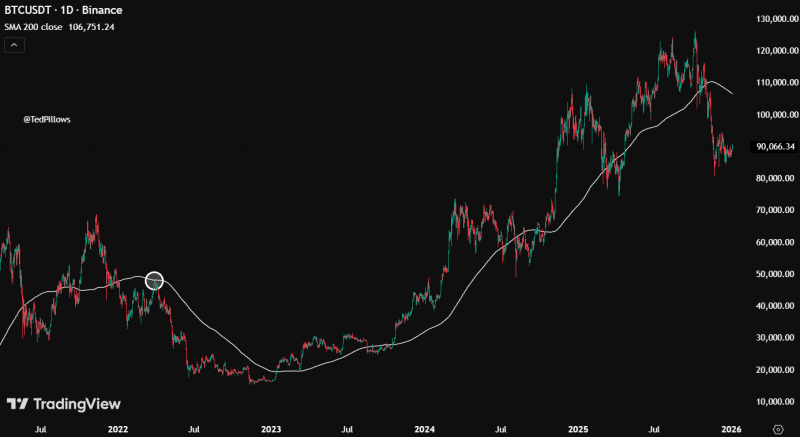
⬤ The chart reveals BTC climbing in a broad upward trend since bottoming in 2022, with the price spending most of the recent bull run above the rising SMA200 curve. Compare that to 2022, when Bitcoin approached the moving average and failed while trapped in a downtrend. Right now, BTC has pulled back from its all-time high and settled near $90,000, while the SMA200 keeps rising steadily below price. The big question: will Bitcoin test this moving average again, or will it push back toward the $100,000-$110,000 zone?
⬤ The SMA200 works as a long-term mood ring for Bitcoin. Historically, when BTC trades consistently above this level, it signals bullish macro conditions. Throughout late-2023 and 2024, Bitcoin trended well above the moving average, showing strong upward momentum. The current consolidation is narrowing that gap, putting the spotlight on whether Bitcoin can maintain its trend and regain upside momentum before hitting the $106,751 mark.
 Saad Ullah