 Usman Salis

⬤ Bitcoin ($BTC) is hovering near recent highs as traders zero in on a crucial resistance level around $90,420. Bulls need to push BTC above this price point to keep the upward momentum alive. The 30-minute chart shows Bitcoin climbing from recent lows and pressing toward this barrier after days of sideways movement.
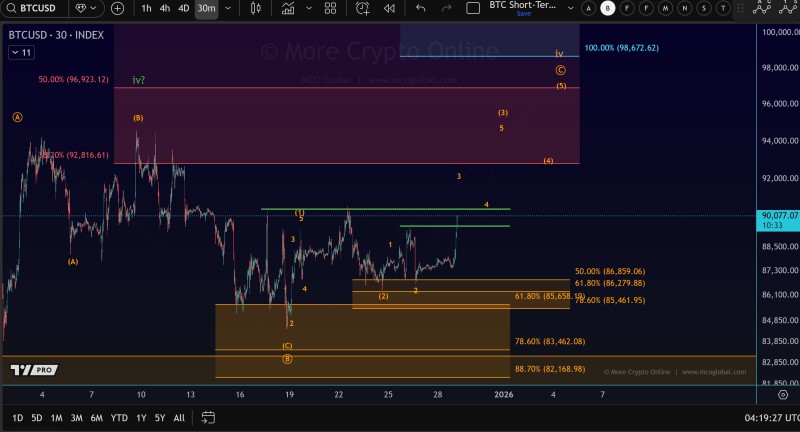
⬤ The $90,420 level stands out as the key resistance traders are monitoring right now. Below, Fibonacci support zones sit between roughly $85,500 and $88,800 – areas where Bitcoin found its footing before. BTC has bounced from these lower levels and is now challenging the overhead resistance. Elliott Wave patterns on the chart hint at a developing price structure that could push into the mid-$90,000s if the momentum holds.
⬤ Support levels matter just as much if the rally stalls. If Bitcoin can't break above $90,420 soon, those retracement zones around $86,000 to $88,000 will likely come back into play. The price action shows Bitcoin making higher lows but still struggling with resistance above.
⬤ This technical setup matters because Bitcoin drives sentiment across the entire crypto market. A solid move above $90,420 would boost bullish confidence and support the case for more gains ahead, while a rejection here would mean more sideways trading. With volatility still running high and BTC sitting at a critical technical level, all eyes are on how price handles this resistance zone.
 Usman Salis


