Saad Ullah

⬤ Bitcoin has hit a critical technical point after confirming lower lows on the 12-hour chart. BTC now faces a major resistance zone between $80,000 and $90,000—what's being called the final exit zone before a potential bigger drop.
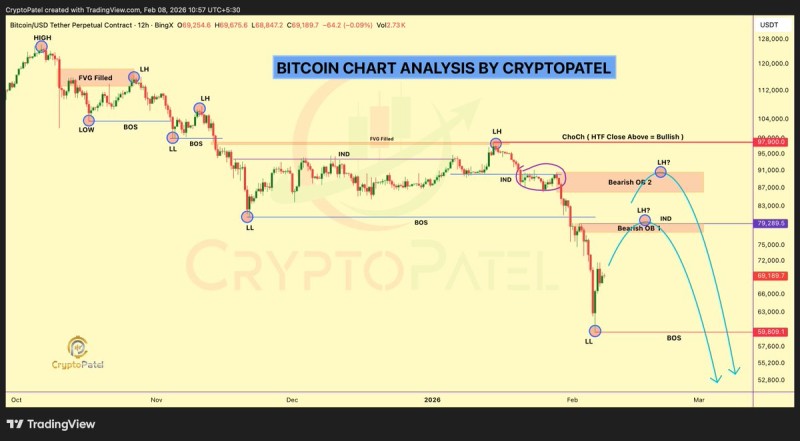
⬤ The chart shows a shift near $97,900 followed by a breakdown that pushed price down to around $59,809, marking a fresh lower low. After that decline, BTC bounced back toward $69,189 and $79,289—both flagged as supply and order block zones. The pattern of lower highs throughout confirms the downtrend is taking shape.
⬤ Bearish order blocks and imbalance zones sit overhead, signaling spots where price might react if BTC tries to push higher. The projected path suggests a possible move back into the $80K–$90K range before continuing lower, with a deeper downside scenario pointing all the way down to $40,000.
⬤ Right now, BTC is at a key structural crossroads. How it interacts with these marked zones will likely decide what comes next. If it can't reclaim the upper supply areas, that lower target zone stays very much in play.
 Saad Ullah