 Marina Lyubimova

⬤ Bitcoin is stuck below critical value area levels on the 12-hour chart, with the local range low now sitting right at the macro range Value Area Low—making this zone a make-or-break technical threshold. BTC is trading beneath this level, showing that sellers are still in control and blocking any real recovery momentum.
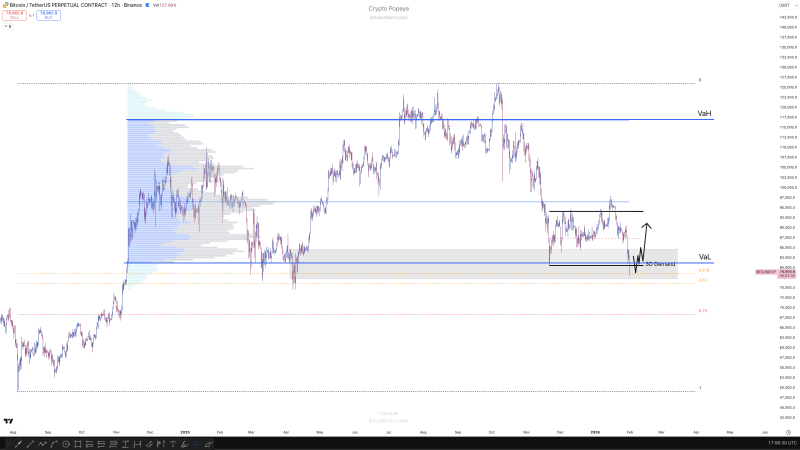
⬤ The chart shows Bitcoin previously bouncing between Value Area High and Value Area Low before breaking down. After losing the range midpoint, BTC couldn't reclaim VaL and instead kept grinding lower. There's a visible demand zone acting as temporary support below current price, but without taking back VaL, any upside move lacks structural backing.
⬤ If current support breaks, the downside gets uglier. Below the demand zone sit several high timeframe Fibonacci levels that could become targets. As long as BTC stays under VaL, these deeper levels remain in play. There's no bullish lower timeframe structure forming yet—no confirmed reversal signals anywhere.
⬤ This setup matters because it draws a clear line in the sand for recovery. Bitcoin needs to reclaim the macro range VaL to flip the script back to bullish. Until that happens, expect more sideways action or further drops toward those high timeframe support levels, keeping the broader market in wait-and-see mode.
 Marina Lyubimova


