Saad Ullah

Bitcoin's drop under $97,000 caught many traders off guard, but the real story is in what led up to this moment. This wasn't just one bad day—it's the result of weeks of mounting pressure and failed recovery attempts. Now sitting below a major psychological threshold, Bitcoin faces its most uncertain period in months.
Bitcoin Breaks Down Below $97K as Weakness Continues
The slide beneath $97,000 grabbed headlines fast, but the chart tells us this was coming. The 1-hour view shows a steady deterioration that started back in late October. Bitcoin hasn't been able to push higher or hold rallies, and what we're seeing now is that weakness finally breaking through.
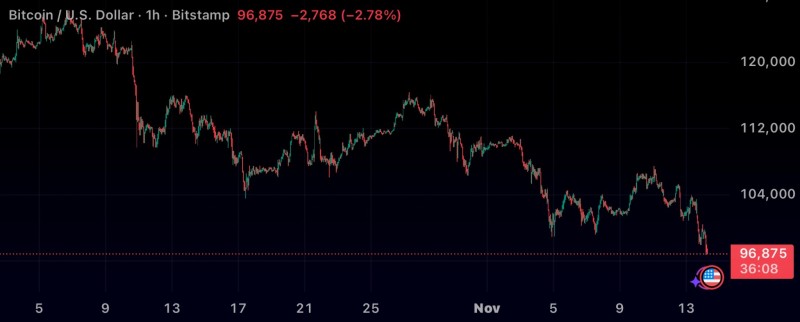
The chart paints a clear picture of what's been happening. For weeks now, Bitcoin's been making lower highs—each bounce getting weaker than the last. Attempts to recover near $104K and $106K got shut down hard, and by early November it was obvious the bulls were losing steam. Every time price tried to rally, sellers stepped in heavier.
The move below $97K matters because it takes out a support level that had been holding up pretty well on shorter timeframes. You can see it marked on the chart with a dotted line—that was the last line of defense before things opened up to the downside. The breakdown came with those long red candles that show real selling volume, not just drifting lower. There wasn't much of a fight from buyers either, which tells you sentiment has shifted. Price just flushed straight through into an area where there's less trading history, and when that happens, moves can accelerate fast. Right now, momentum's pointing down.
Why This Pullback Is Happening
A few things are driving this correction. The broader market's been in risk-off mode lately—yields climbing, economic concerns creeping back in. Bitcoin might be called digital gold, but it still trades like a high-beta asset when macro turns sour. After that monster rally toward $110K and beyond, plenty of holders decided it was time to take profits. That kind of selling naturally leads to pullbacks. ETF flows have cooled off too, which had been one of the biggest sources of buying pressure earlier this year. And once price started dropping, it likely triggered cascading liquidations from overleveraged long positions, making the move even sharper.
Key Levels Worth Watching
On the downside, immediate support sits around $95,500 to $96,000—that's where buyers might try to make a stand in the very short term. If that doesn't hold, $92,000 becomes the next meaningful level, and below that you're looking at $88,000 as a deeper correction zone. For resistance, $100,000 is the big psychological barrier everyone's watching. Above that, you've got $104K to $106K, which used to be support but will now act as resistance. Then there's $112K up top as a macro resistance point. Getting back above $100K would be the first real sign that buyers are regaining control.
 Saad Ullah