 Peter Smith

Bitcoin's been stuck in a strange routine this year—every time the Federal Reserve wraps up an FOMC meeting, the price takes a hit. It's happened five times now since June, and the pattern is getting hard to ignore.
Why FOMC Meetings Matter
Fed meetings are huge for risk assets like Bitcoin. When the Fed talks tough on rates or delays cuts, traders typically pull back from volatile assets. But dovish signals? Those tend to spark short-term rallies. The repeated post-FOMC dips on the chart reflect this push-and-pull as the market recalibrates expectations each time.
Crypto analyst Ash Crypto has been tracking this cycle closely, noting that Bitcoin has been trading sideways for months while consistently dipping after each policy announcement. The big question now: is this latest drop the final shake before Bitcoin finally breaks out?
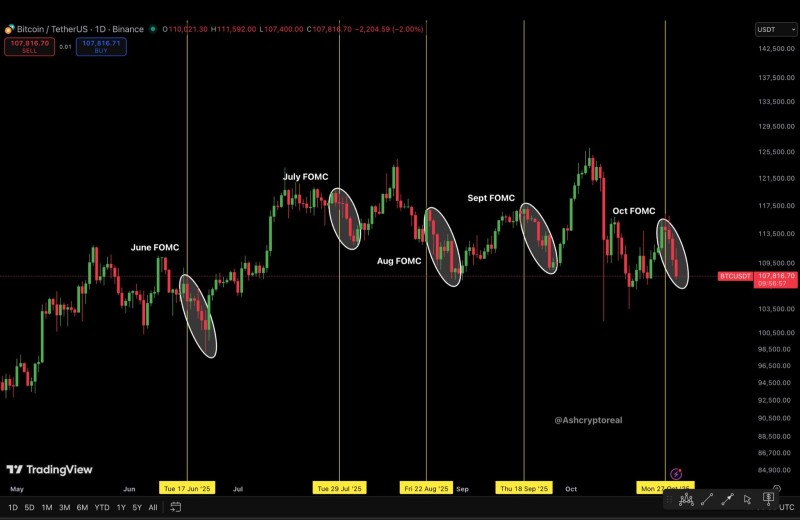
Since June, Bitcoin's chart tells a clear story. Each FOMC meeting—marked by yellow lines on the daily chart—triggered a temporary rally followed by a quick pullback. Here's how it played out:
- June 17: BTC reversed from near $112,000 down to $102,000
- July 29: Another drop wiped out most of the month's gains
- August 22: Bitcoin corrected back toward $104,000
- September 18: A smaller but noticeable dip followed
- October 27: The latest meeting sent BTC sliding again, now trading around $107,816—down about 2% on the day
This pattern suggests traders are cutting risk around Fed decision weeks, creating predictable volatility spikes every time.
For the past four months, Bitcoin has been boxed in between $102,000 and $121,000. Each rally has stalled near the top, while support around $105,000 keeps holding. The chart shows lower highs, hinting at caution rather than outright weakness. Volume's been moderate, and there's no clear breakout signal yet—either up or down.
The "Final Shakeout" Idea
Thinks this latest pullback might be the last one before Bitcoin gets moving again. Historically, Bitcoin often goes through several corrections within a larger uptrend before momentum really kicks in. If BTC holds above $105,000, a bounce toward $115,000–$120,000 could be in the cards for November. Breaking cleanly above $121,000 would likely signal the end of this four-month sideways grind and potentially open the door to new highs.
What's Next?
Whether this FOMC-linked weakness keeps going depends mostly on upcoming inflation and jobs data from the U.S. If the numbers come in softer, that could ease selling pressure and bring institutional buyers back in. For now, traders are watching to see if history repeats itself once more—or if October's dip finally closes the book on this pattern.
 Peter Smith


