 Saad Ullah

⬤ Bitcoin's currently stuck in consolidation mode, forming what traders call a descending triangle pattern. You'll see this chart setup a lot when the market's indecisive—price keeps bouncing between lower highs and higher lows, basically coiling up before it makes its next big move. Think of it as BTC getting ready to break out in one direction or another.
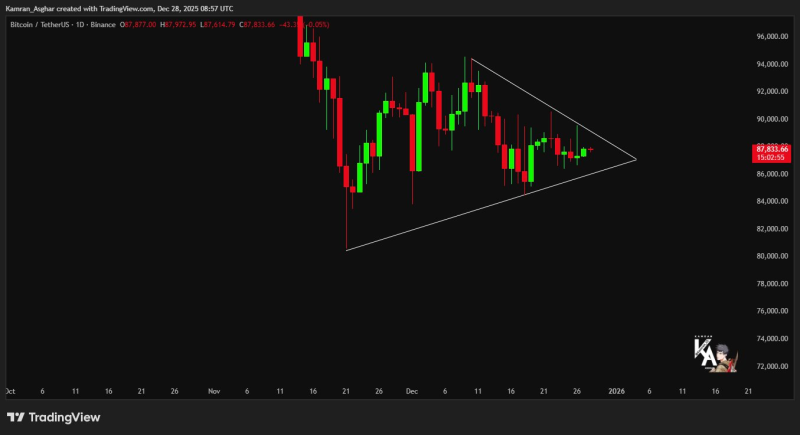
⬤ Here's the critical part: bulls absolutely have to defend that support level marked in green. If it holds? We'll probably see a bounce. But if it breaks? Bitcoin could quickly slide down to that $80,000 range. Breaking below this support would be a red flag that more downside's coming.
⬤ Now, descending triangles usually break in the direction of the previous trend—and Bitcoin's been trending up. But here's the thing: that support line's getting tested hard right now. A strong bounce here could mean the bullish run continues, but if bulls can't hold it, we're looking at a potential shift in market sentiment and maybe even a sell-off.
 Saad Ullah


