 Marina Lyubimova

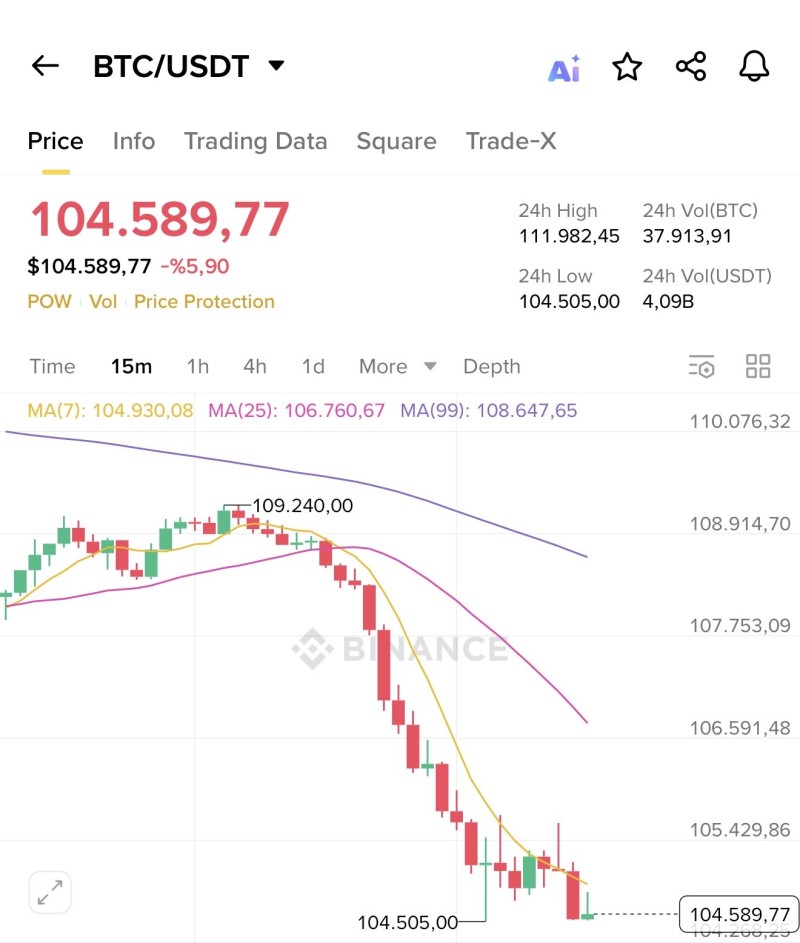
Bitcoin finally broke below the $105,000 mark, catching the attention of traders everywhere. While the giveaway grabbed headlines, the chart tells a more important story about where Bitcoin might be headed next.
What the Chart Shows
The move came alongside a viral tweet from Mr. Crypto Whale, who highlighted the breakdown and announced a 1 BTC giveaway (worth over $100,000) to a random follower. The BTC/USDT chart on Binance reveals a clear shift in momentum. After hitting a peak near $109,240, Bitcoin dropped almost 6% in 24 hours, bottoming out around $104,505. The price is now sitting below three key moving averages—the 7-day, 25-day, and 99-day—which suggests sellers are in control. Resistance has formed around $106,700 to $108,900, while support is holding near $104,500. If that breaks, the next real floor could be closer to $103,000, with $100,000 not far behind.
Why Bitcoin Is Falling
There are a few reasons behind the drop. First, after pushing toward $110K, many traders decided to lock in profits. At the same time, macro conditions aren't helping—stronger dollar, higher bond yields, and general caution around risk assets are weighing on crypto. Add in some fear-driven selling and social media hype around giveaways, and you've got a recipe for volatility.
Bitcoin's drop below $105,000 isn't just noise—it's a real test of market strength. If buyers step in and hold the $104,500 level, we could see a bounce back toward $107,500. But if that support gives way, the path down to $100,000 starts looking a lot more realistic. For now, volatility is the name of the game, and staying disciplined matters more than ever.
 Marina Lyubimova


