Artem Voloskovets
After months of steady climbing, Bitcoin just hit its first real technical bump of the year. The crypto dropped sharply below the rising trendline that's been guiding its rally since mid-2024, falling from around $106,500 to just under $100,000. Now all eyes are on a critical support zone between $91,000 and $89,000. Whether Bitcoin bounces or breaks through could determine if this is just a breather or the start of something uglier.
What the Chart Is Telling Us
Market analyst Lucky Chart Ape put it bluntly: "With the $BTC trend breaking — this is the next major level of interest. If we lose that, I hope everyone was managing risk."
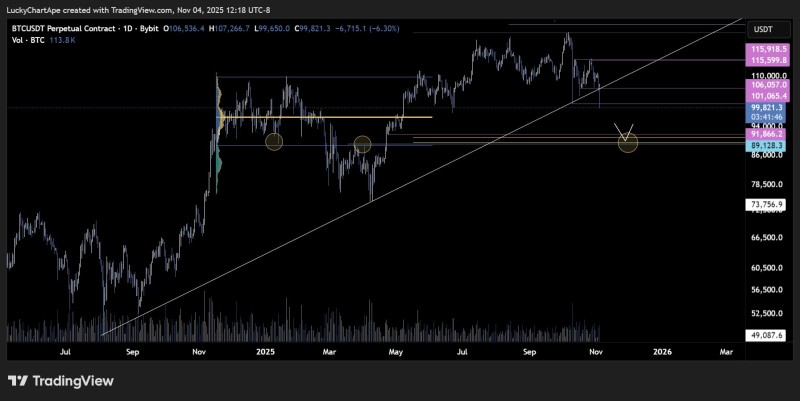
Bitcoin's daily chart shows the ascending trendline—which connected higher lows since late 2024—has been decisively broken. That line supported BTC's climb from the $60,000s all the way past $110,000, so losing it is a big deal. Here's what matters now:
- The trendline break signals weakening bullish momentum and often leads to mid-term pullbacks
- Key support sits at $91,866 to $89,128—this yellow zone on the chart marks previous accumulation areas and high-volume nodes where buyers stepped in before
- If $89,000 fails, expect a sharper drop toward the next major base around $73,700
The volume is solid at 113.8K BTC, so this isn't some thin, low-liquidity move—it's real selling pressure.
Why Bitcoin Is Slipping
Bitcoin's pullback fits into a broader risk-off vibe across markets. Profit-taking kicked in near all-time highs above $110,000, and a stronger U.S. dollar plus rising bond yields aren't helping speculative assets like crypto. Add in some reduced liquidity as traders wait for macro data and ETF flow updates, and you've got a recipe for short-term derisking.
That said, the long-term picture isn't falling apart. On-chain data still shows institutional wallets accumulating, meaning there's structural demand underneath the volatility. For now though, Bitcoin needs to prove it can hold support—or traders might be in for a rougher ride ahead.
 Artem Voloskovets