 Eseandre Mordi

Solana's price structure has turned decisively bearish after losing the $120-$130 support zone that previously held the market together. With SOL now hovering around $84, sellers are clearly in control, and the chart is sending some uncomfortable signals for anyone hoping for a quick recovery.
Breakdown Confirms Bearish Shift
The loss of the $120-$130 zone isn't just a number on a chart. It was the structural backbone that kept Solana's price action from unraveling. Once that level gave way, the chart shifted from "consolidating" to "breaking down." SOL has since printed a series of lower highs, with every attempted bounce getting sold into, a classic sign that buyers don't have enough conviction to reclaim lost ground.
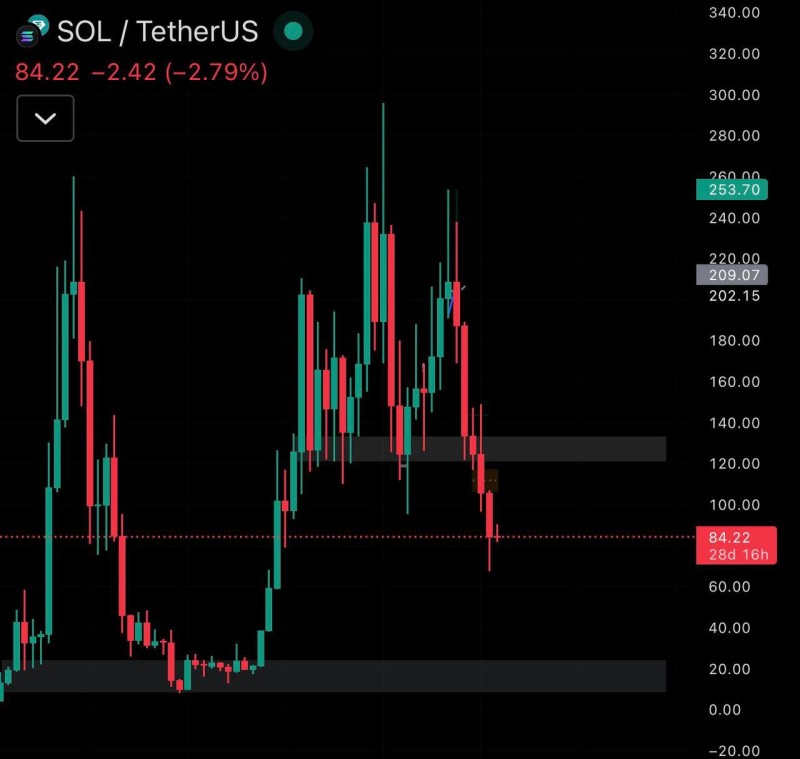
The $120-$130 area has now flipped into resistance. Until SOL can close back above it convincingly, the path of least resistance remains down.
Key Levels to Watch: $75 Support and $245 Resistance
On the downside, Solana has been defending a $75 support zone while attempting to rebound toward $90, making that range the immediate battleground. If $75 holds, some stabilization is possible. If it fails, the next meaningful floor sits in the $60-$70 range, a level that aligns with prior structural zones from earlier in Solana's price history.
SOL's movement around key support and resistance zones will determine whether this is a temporary shakeout or the beginning of a more extended decline. On the upside, any recovery attempt faces a much harder road. Critical resistance concentration around $245 could again cap gains if price ever reaches that level, reinforcing just how fragile Solana's multi-timeframe structure currently looks.
For now, the burden of proof sits with the bulls. Reclaiming $120 with momentum would change the narrative. Anything short of that keeps the bearish case alive, with $60-$70 remaining a realistic destination if selling pressure continues.
 Eseandre Mordi


