 Peter Smith

⬤ Bitcoin is sitting at what could be a make-or-break moment right now. The price is dancing around an ascending support trendline on the daily chart, and things are getting tense. BTC is holding in the upper $80,000 range after a rough selloff, and traders are watching closely to see if this support will hold or give way.
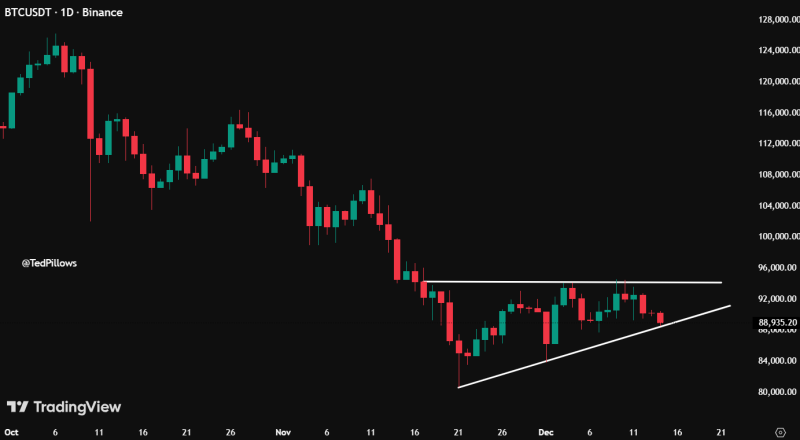
⬤ The technical picture shows Bitcoin caught in a squeeze. It's been making higher lows along that rising support line, but there's a ceiling overhead too—resistance sitting around $92,000 to $94,000 that keeps rejecting any upward attempts. This tightening pattern shows the market can't quite decide which way it wants to go next. Bulls haven't been strong enough to punch through resistance, and bears haven't managed to crack support yet.
⬤ Here's what really matters: that ascending trendline has been reliable support through multiple dips recently. If Bitcoin closes below it on a daily basis, that's when things could get interesting.
A decisive daily close below this trendline would invalidate the current support and could open the door for a move toward the $80,000 area.
⬤ That $80,000 zone lines up with previous consolidation areas and visible buying interest on the chart, making it the natural next stop if support fails. This matters beyond just Bitcoin itself. When BTC moves, the rest of the crypto market tends to follow. A breakdown below this trendline could spark selling pressure across digital assets and crank up volatility. On the flip side, if Bitcoin defends this support successfully, it might help steady the ship and give the market some breathing room. Either way, what happens at this technical junction is likely to set the tone for where crypto heads in the short term.
 Peter Smith


